"Happiness”, round 4
Back to the measure the bot and I co-created. It you don’t like the name “happiness”, that’s fine. It’s related in some way to satisfaction with the order in which the election method picked winners, but I wouldn’t claim it measures “actual human happiness” to even one significant digit.
[EDIT: rewrote for more rigor]
What it does is give one clean way of measuring how close the structure a ballot expresses is to the outcome actually seen. Where C is the number of candidates, and W the number of winners, it’s the L^1 (“Manhattan” or “taxicab”) distance between a point in C-dimensional “outcome space” to the closest point in a hyperrectangle (“box” for short) in C-dimensional “ballot space”, provided the point isn’t within the box. Coordinates in ballot space span 1 through C. Outcome space assigns ranks 1..W to the winners, and rank W+1 to all non‑winners. So it’s usually rare that an outcome is within a ballot’s ideal box.
As explained briefly before, a ballot defines an “ideal interval” structure, which is independent of W. For each candidate, this gives the range of result ranks the ballot is perfectly happy with.
Let’s pick a random ballot with 3 equivalence classes, and see what this structure is:
>>> random.seed(789)
>>> while len(distinct(e := random.choice(ballots))) != 3:
...     pass
...
>>> pprint(e)
{'Barry Warsaw': 5,
 'Donghee Na': 3,
 'Gregory P. Smith': 5,
 'Pablo Galindo Salgado': 4,
 'Savannah Ostrowski': 3,
 'Thomas Wouters': 5}
>>> w = Ballot(e)
>>> pprint(w.ideal_interval)
{'Barry Warsaw': (1, 3),
 'Donghee Na': (5, 6),
 'Gregory P. Smith': (1, 3),
 'Pablo Galindo Salgado': (4, 4),
 'Savannah Ostrowski': (5, 6),
 'Thomas Wouters': (1, 3)}
The ballot gave 5 stars to 3 candidates, so it’s saying it’s happiest if they appear at ranks in (1, 3) inclusive, but has no preference among their order, Its sole 4-star rating then belongs at rank 4. The remaining 2, with 3 stars each, are best at ranks 5 and 6. For any ballot, any two ideal intervals are either the same, or disjoint, and all together span all values in 1..C. The ideal box is then just the Cartesian product of the candidates’ ideal intervals.
The ideal intervals define the ballot’s ideal C-dimensional box. A ballot is “perfectly happy” if and only if an outcome is within its ideal box (every candidate’s actual rank is within the ballot’s ideal interval for that candidate).
What does an outcome deliver? A total ranking from 1 through W, and effectively an equivalence class containing all those who didn’t win a seat. For convenience and simplicity, the code just calls that (the fictional) rank W+1. “The math” stays simple then, and the distance measure quite smooth and gradual across small changes in outcome orders. It’s a point in C-dimensional space, but with coordinates from a smaller range than in a ballot’s ideal box.
The heart of the “happiness measure” then is actually an “unhappiness” measure: how far removed from the outcome is the ballot’s ideal interval structure?
def winner_displacement(winner_seq, ideal_interval):
    total = 0
    cand2rank = {c : i for i, c in enumerate(winner_seq, start=1)}
    last_rank = len(cand2rank) + 1
    for c in scands:
        if c not in cand2rank:
            cand2rank[c] = last_rank
    for c, actual_rank in cand2rank.items():
        s, e = ideal_interval[c]
        if actual_rank < s:
            total += s - actual_rank
        elif actual_rank > e:
            total += actual_rank - e
    return total
It’s just summing the distances of the actual outcome’s ranks from the closest endpoint of a candidate’s ideal interval (or adding nothing if the actual rank is in a candidate’s ideal interval).
A very desirable property of this measure is that a ballot’s maximum possible displacement can be computed in advance quickly, linear in C. Some earlier abandoned measures required enumerating all possible perm(C, W) outcomes to find the max. For our example:
>>> w.max_disp
14
So it just remains to divide the actual displacement by 14, and subtract that from 1.0.
Ha! It took a long time to realize this: it’s purely an accident of C=6 and W=5 that a displacement of 0 is always possible. In general, there’s also a minimum possible displacement.
>>> w.min_disp
0
[EDIT: repaired bad example]
For example, consider a 10-candidate election with 2 winners. If a ballot gives its highest rating to 3 candidates, it’s not possible for any outcome to have total displacement 0. The ideal interval for the three favorites is (1, 3)., and for all the other 7 candidates their ideal interval starts with at least rank 4. Each is displaced by at least one from the outcome’s catch-all “didn’t win” sentinel rank of 2+1 = 3.
But it’s also possible to compute the smallest possible displacement cheaply in advance, and rescaling to fit the actual possible displacement range is straightforward:
    def happiness(self, winners):
        if len(winners) != self.nseats:
            raise ValueError(
                f"Expected {self.nseats} winners, got {len(winners)}")
        actual_disp = winner_displacement(winners, self.ideal_interval)
        self.actual_disp = actual_disp
        lo, hi = self.min_disp, self.max_disp
        assert lo <= actual_disp <= hi
        span = hi - lo
        result = (1.0 - (actual_disp - lo) / span) if span else 1.0
        assert 0.0 <= result <= 1.0
        return result
These min/max bounds are sharp: achieved by some (at least one) possible outcome.
I won’t show more code unless there’s demand for that.
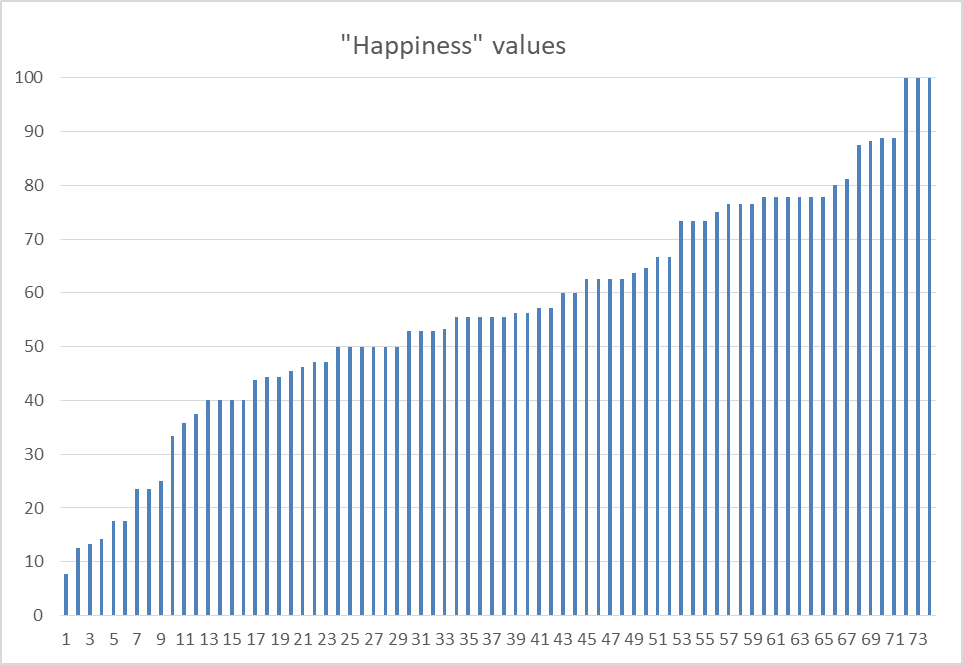
While the bot is a whiz at deducing things from decile accounts, I’m not, and doubt many people are. So instead here’s just a plot of the value distribution (after multiplying by 100.
It’s possible again to compute total happiness across all ballots across all 720 possible outcomes. In a small fraction of a second, in fact. The outcome STAR delivered came in 4th place then, although there’s very slight difference in rearranging the order of the last few candidates picked.
Note that this is akin to the “parallel” versions of Jefferson and Webster proportional Block Approval: don’t do “one at a time”, optimize a function over all outcomes. Ties are almost impossible then.
The measure developed here could also be used to check results from Condorcet-method elections (whether or not they allow expressing equal preferences), IRV/“Ranked Choice” elections, and even pure-score elections.