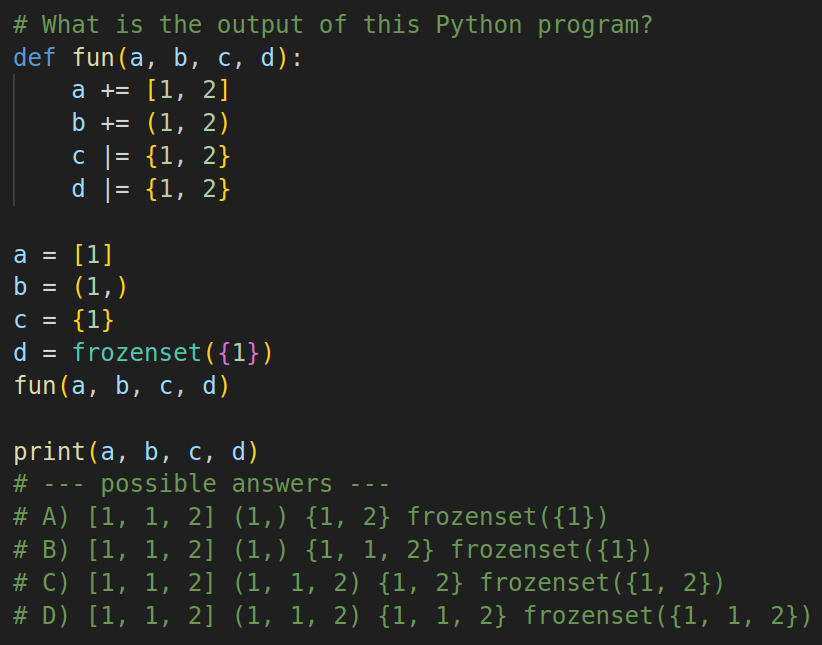
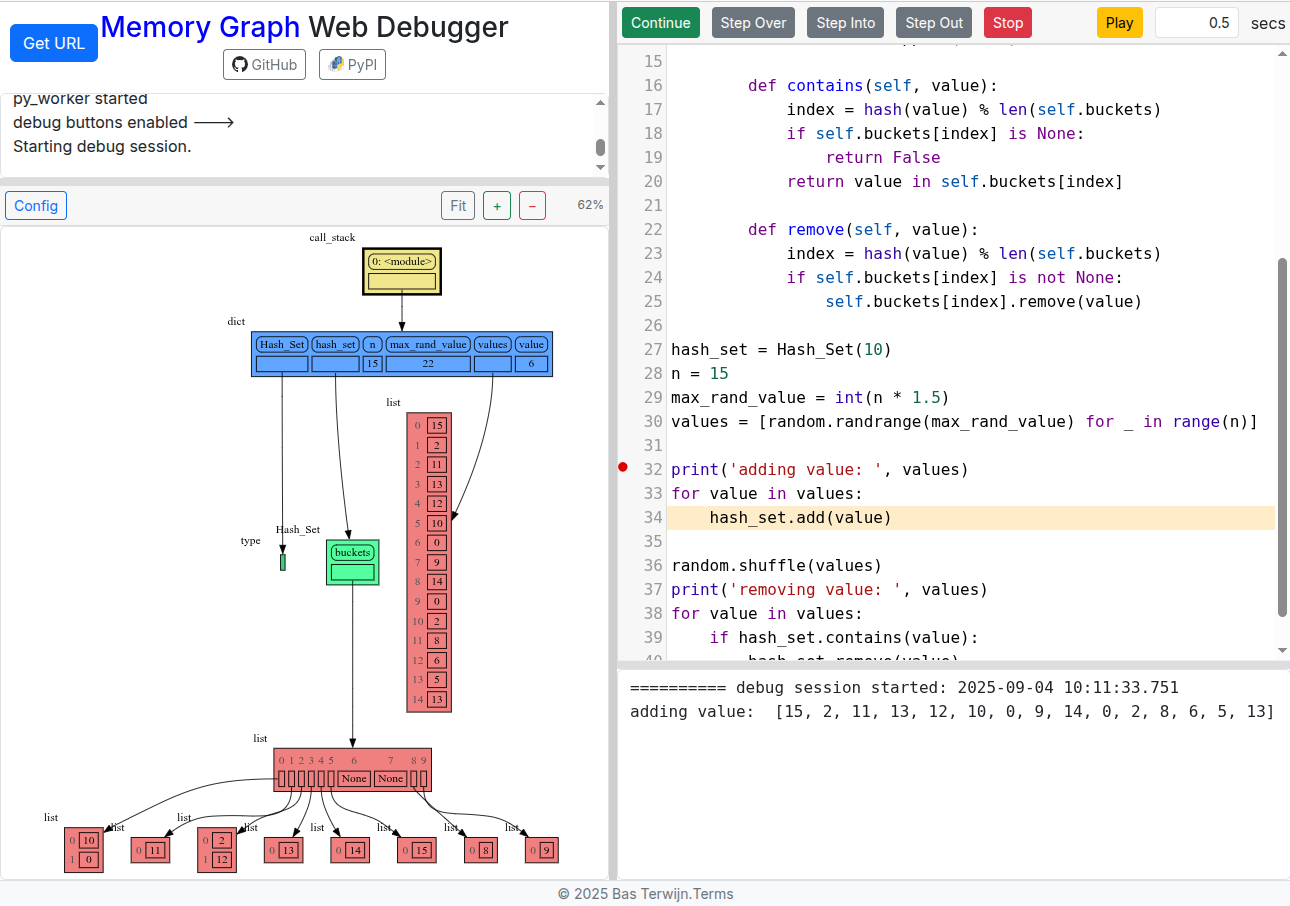
My only nitpick is that sets are currently displayed in the same way as lists and tuples with elements numbered. This might be misleading, since the sets are not subscriptable and the element ordering in a set is not specified by the language.
IMHO it would make sense to remove the indices from the set visualizations and keep only the elements (in the picture, remove 0, 1 and keep only 5, 6). This would be more accurate and would also visually better distinguish sets from the lists and tuples (and would also save some minor space ).
Thanks for your feedback, much appreciated. A set is not subscriptable, but iterating over it does give an order generated by element hash values, and that is what currently is used for the numbering. But because of randomized hash seeds this order might not be stable over different runs or even when adding/removing elements. So I agree that this numbering can easily mislead people and that removing the indices would probably give a better representation. I’ll put it on my todo list, thanks for your suggestion.
We could make pprint() work, I’ve focused on just print() for now.
It is possible to install additional packages using micropip (not in the user interface yet), but that is limited to pure Python or Pyodide builtin packages: Micropip API — Version 0.20.0
But if you want to do these more advanced things it is probably better not to use the Memory Graph Web Debugger but to install memory_graph locally. Then everything works as normal and you can use your preferred IDE/environment.
Moving this to the Python Help category, since it seems more like a project advertisement or bug finding, than a request for feedback in regards to education. That isn’t the purpose of the Python in Education category.
Are you sure? Because it’s primarily education material (visualizing and explaining Python data model concepts with related exercises), and I was getting helpful feedback. It’s not that I’m asking for help on programming problems.
@petersuter I’ve now added the option to install packages using micropip, and I capture all stdout/stderr output and not just print(), so now all output including that generated by pprint() is shown. See this pandas example. Thanks for your feedback.
Still Python in the browser comes with limitations, so installing memory_graph locally is still recommended.
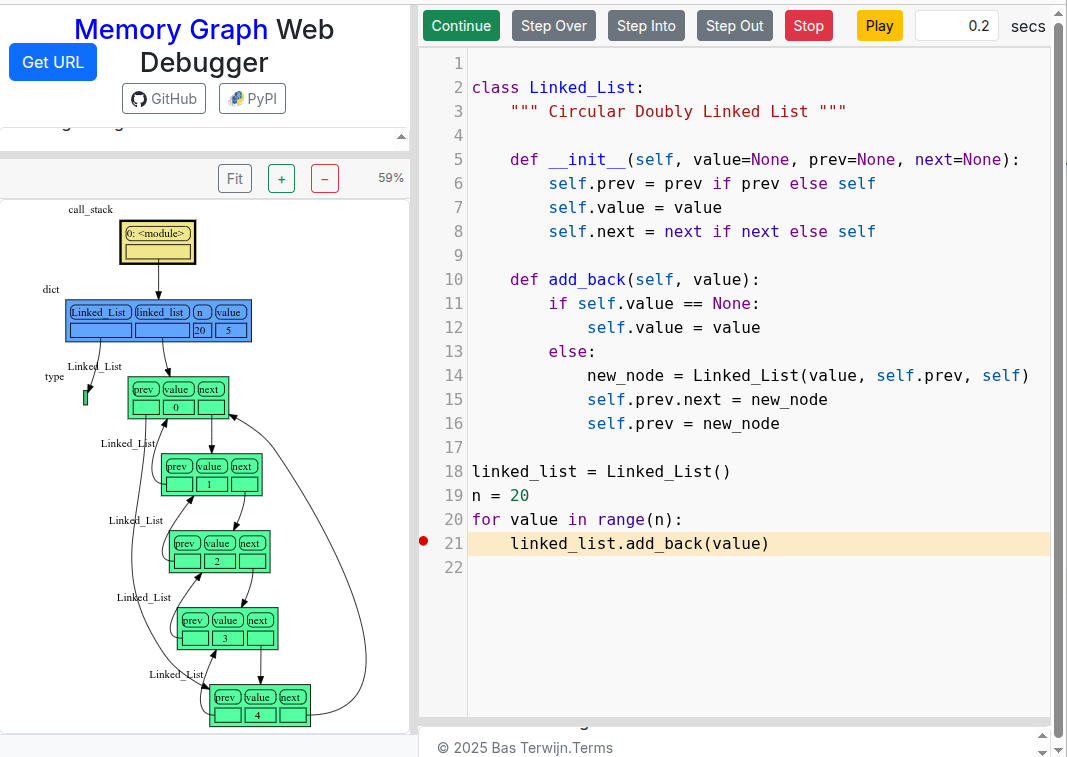
Recursion gets easier when you can see that every function call has its own variables on the call stack. As example we recursively convert an integer from decimal to binary representation in this live demo.