That book rang a bell and I went looking. Turns out I bought the third edition a year ago but found it a bit heavy and went through an on-line one where I could copy the code to try. Now that I’ve learned a bit I will go back to it and maybe get the pdf version (6th edition) so I can try the examples without having to type them in from a physical book. Thanks.
edit: I see the examples are available on Github for download so I can use the hard copy and not have to transcribe the code.
Third Edition was released back in 2007 and was updated for the at the time recently released Python v2.5. The 6th Edition was just recently released a few months ago and updated for Python v3.12+. For reference, Python 3.14 is scheduled to be released this October. The case selection statement that you were initially planning on using for your current project was not available until Python v3.10. The 3rd Edition is definitelyy outdated - and focused for Python v2.x - many things have changed since then.
I agree, this book is a bit heavy. But it is because it is more thorough compared to run of the mill “tutorial” type of books where they teach you one concept and quickly move on to the next. This book really does get into the weeds - more of a college level kind of book. But it is, in my opinion, very well written, with plenty of examples, so you don’t get lost.
Thus, there is a difference between ‘knowing’ and ‘understanding’. This book aims for the latter. This is why I recommend it (though requires a bit more effort, I know). There is no point in knowing the dots if you can’t connect them. Note that what you will be learning in this book is the language itself (including a lot of subtle nuances) and so does not take a project learning approach. You actually learn the language itself which you can apply to ANY project.
Generally, it helps if you read the book in a linear approach as each subsequent chapter builds on material from previous chapters. If you decide to jump into a chapter without having studied earlier material, it will be challenging (unless of course, you already have some experience with the topic at hand).
Well, I do hope that you get it. It is a very good book and a good read. ![]()
![]()
I tried the book and jumped in at Plotting and Visualization and found their code did not run. Probably because it is incomplete or assumes Jupyter. I should look in Github and see what they have. It seems they select lines and reference just those lines.
I went to The Python Coding Book and had plots within minutes. Their code always works.
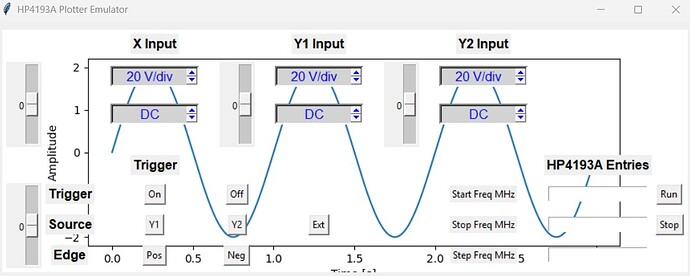
I got this far but obviously have the positional relationship messed up. I seem to have to move my buttons down by 20 rows, I tried 1 down but nothing much happened. I assumed the plot would take one row.
I could not find an example of a button and a plot in the same frame. I guess I have one now.
I also cannot find an example of live plotting point by point. I assume I have to set the axis and draw the frame then fill it in as the data arrives. I need this because plots can take from seconds to 30 seconds from the HP Impedance Analyzer. I want to see them as they plot.
Just quickly reviewed your script again. Here is a recurring theme. Using the same name for different objects:
The first use of the name root refers to the window object itself. The second use of the word root, refers to the frame that you have added to it. This is a no, no. Give the frame a distinct name that fits your application. Remember, every object should each have a distinct name.
Regarding the plot being superimposed on top of the current widgets, this is because you have not created another frame. Thus, whatever you add, will be added to the same frame. My suggestion is to add another frame (make sure it has a distinct name from the first) then configure the script such that the plot is tied to this new frame. When you add another frame, be sure that you explicitly define each grid location (the new frame would then be configured with row = 1, since the count begins at index = 0). Then, the new frame will be placed just below the current one.
Something like this:
# You've already completed this one - what you currently have
frame_1 = tk.Frame(root, text="Configuration Set-Up", font=("Arial bold", 13), pady=10)

# add code here - you have already added this code - what you have now

frame_1.grid(row=0, column=0, padx=10, pady=10)

# Add this additional frame, also tied to the 'root', place just underneath the current one
frame_2 = tk.Frame(root, text="Plot Impedance", font=("Arial bold", 13), pady=10)

# add code here - regarding plot so that it will be placed inside this new frame

frame_2.grid(row=1, column=0, padx=10, pady=10)
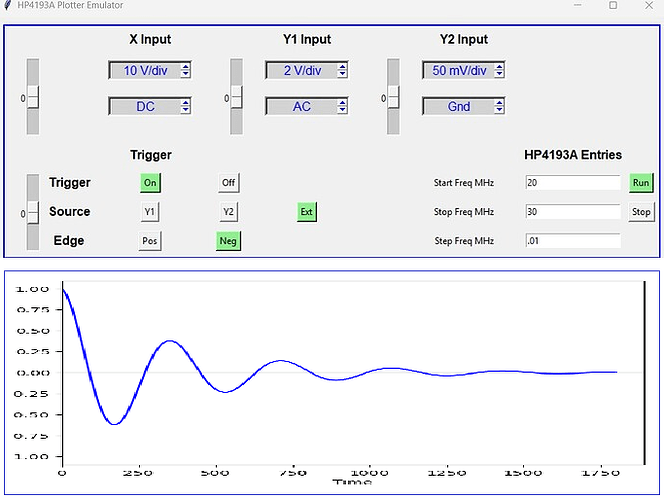
Once you edit your script, and re-run it, it should look something like this (waveform is arbitrary - added for demo purposes is all):
Hope this make sense and helps you.
A great help Paul; I was going to start with something simpler than my ~250 lines of code but would not have thought of your suggestion. This starts me off on the right path.
If I can’t solve it I will open a new thread.
I tried your suggestions and ran into a major problem.
This works:
# 1. Importing Necessary Libraries:
import tkinter as tk
from matplotlib.figure import Figure
from matplotlib.backends.backend_tkagg import FigureCanvasTkAgg, NavigationToolbar2Tk
import numpy as np

# 2. Creating the Tkinter Window and Plot Function:
def plot_data():
    # Create a Matplotlib Figure
    fig = Figure(figsize=(6, 4), dpi=100)
    ax = fig.add_subplot(111)

    # Generate some data to plot
    x = np.linspace(0, 2 * np.pi, 100)
    y = np.sin(x)

    # Plot the data
    ax.plot(x, y)
    ax.set_title("Sine Wave Plot")
    ax.set_xlabel("X-axis")
    ax.set_ylabel("Y-axis")

    # Embed the Matplotlib plot into the Tkinter window
    canvas = FigureCanvasTkAgg(fig, master=root)
    canvas.draw()
    canvas.get_tk_widget().pack(side=tk.TOP, fill=tk.BOTH, expand=1)

    # Add Matplotlib's navigation toolbar
    toolbar = NavigationToolbar2Tk(canvas, root)
    toolbar.update()
    canvas.get_tk_widget().pack(side=tk.TOP, fill=tk.BOTH, expand=1)

# Create the main Tkinter window
root = tk.Tk()
root.title("Plot and Button Example")
root.geometry("800x600")

# 3. Draw the plot
plot_data()

# 4. Adding a Button:
plot_button = tk.Button(master=root, text="Do Something")
plot_button.pack(pady=10)

# Start the Tkinter event loop
root.mainloop()
However I used Grid to place my widgets and I get the following error if I use Grid instead of pack above.
Apparently backend tk.py, in line 675, calls pack (I think). Pack and Grid are not compatible.
I am taking this to a new thread called “Plot & Button using Grid in tkinter”
Place is compatible with Pack so I could try Place Relative to replace Grid.
I am using “Modern Tkinter for Busy Python Developers” by Mark Roseman. It has a chapter on Grid Geometry Manager but barely mentions Pack and Place.
Please don’t reply with suggestions here, see the new thread.


