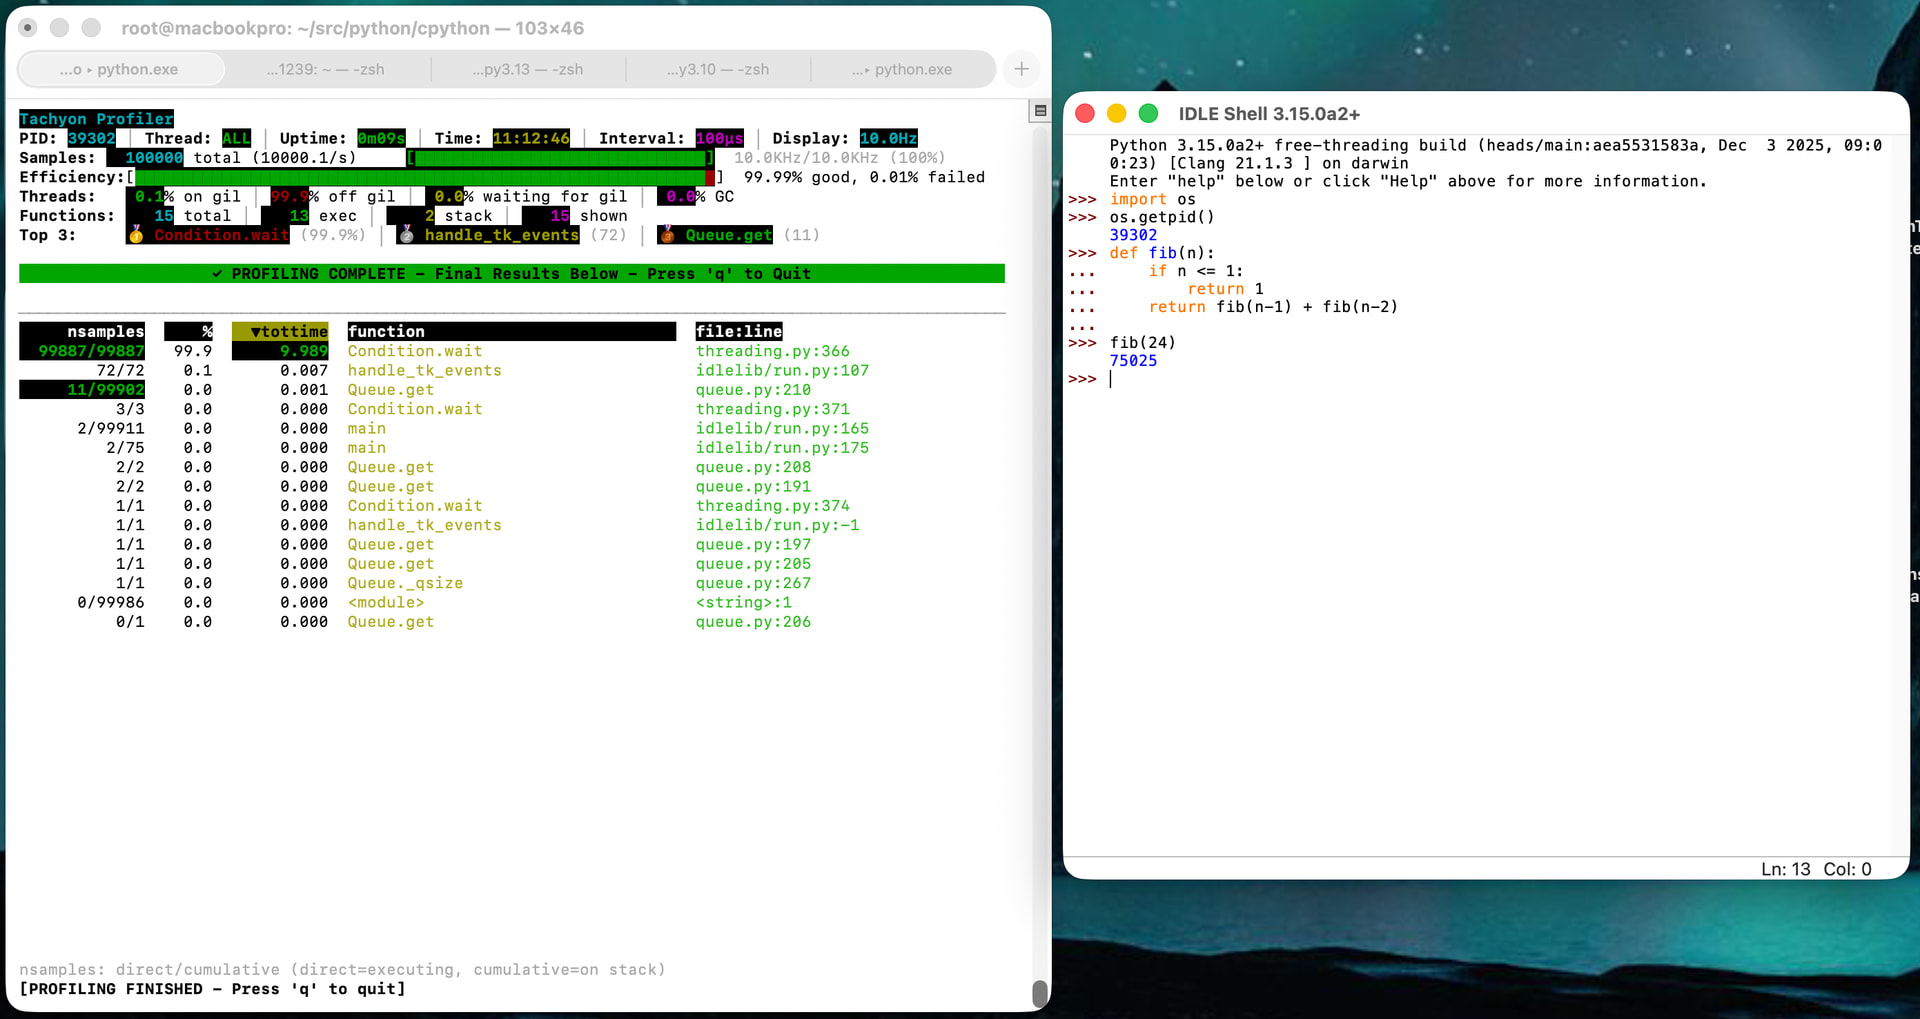
Over on Bluesky, @pablogsal teased a new profiler the other day. The clip he posted shows inspection of individual bytecode instructions. I asked where it was and he replied “main branch.” Cool. I fumbled around a bit, asked for a more precise location, but I think I eventually stumbled on it as the package profiling.sampling. Running that against idle seems to work, but eventually says, “I’m done!” despite the fact that idle is clearly still running":
Can someone offer some hints about how to get it to remain active while the attached process is still running? (I fully understand @pablogsal might well have been running code which hasn’t even been merged to the main branch yet.)
Thanks a lot for giving Tachyon a try . The most important aspect to have in mind currently is that we are still finalizing things and the code is changing a lot so apologies if we don’t have docs yet (soon to be added!). Let me answer some of your questions here:
This is because right now by default it only samples for 10 seconds. You can use the -d parameter to change that. We know is a bad default and we plan to change it soon.
For now use -d 99999 although I am 100% sure we need to change this default.
The per-opcode view is still being developed but will soon be a PR for that
Thanks, @pablogsal . Working my way through the interactive help text I discovered the ten-second default. I’ll keep messing around with it (already have an issue to report).