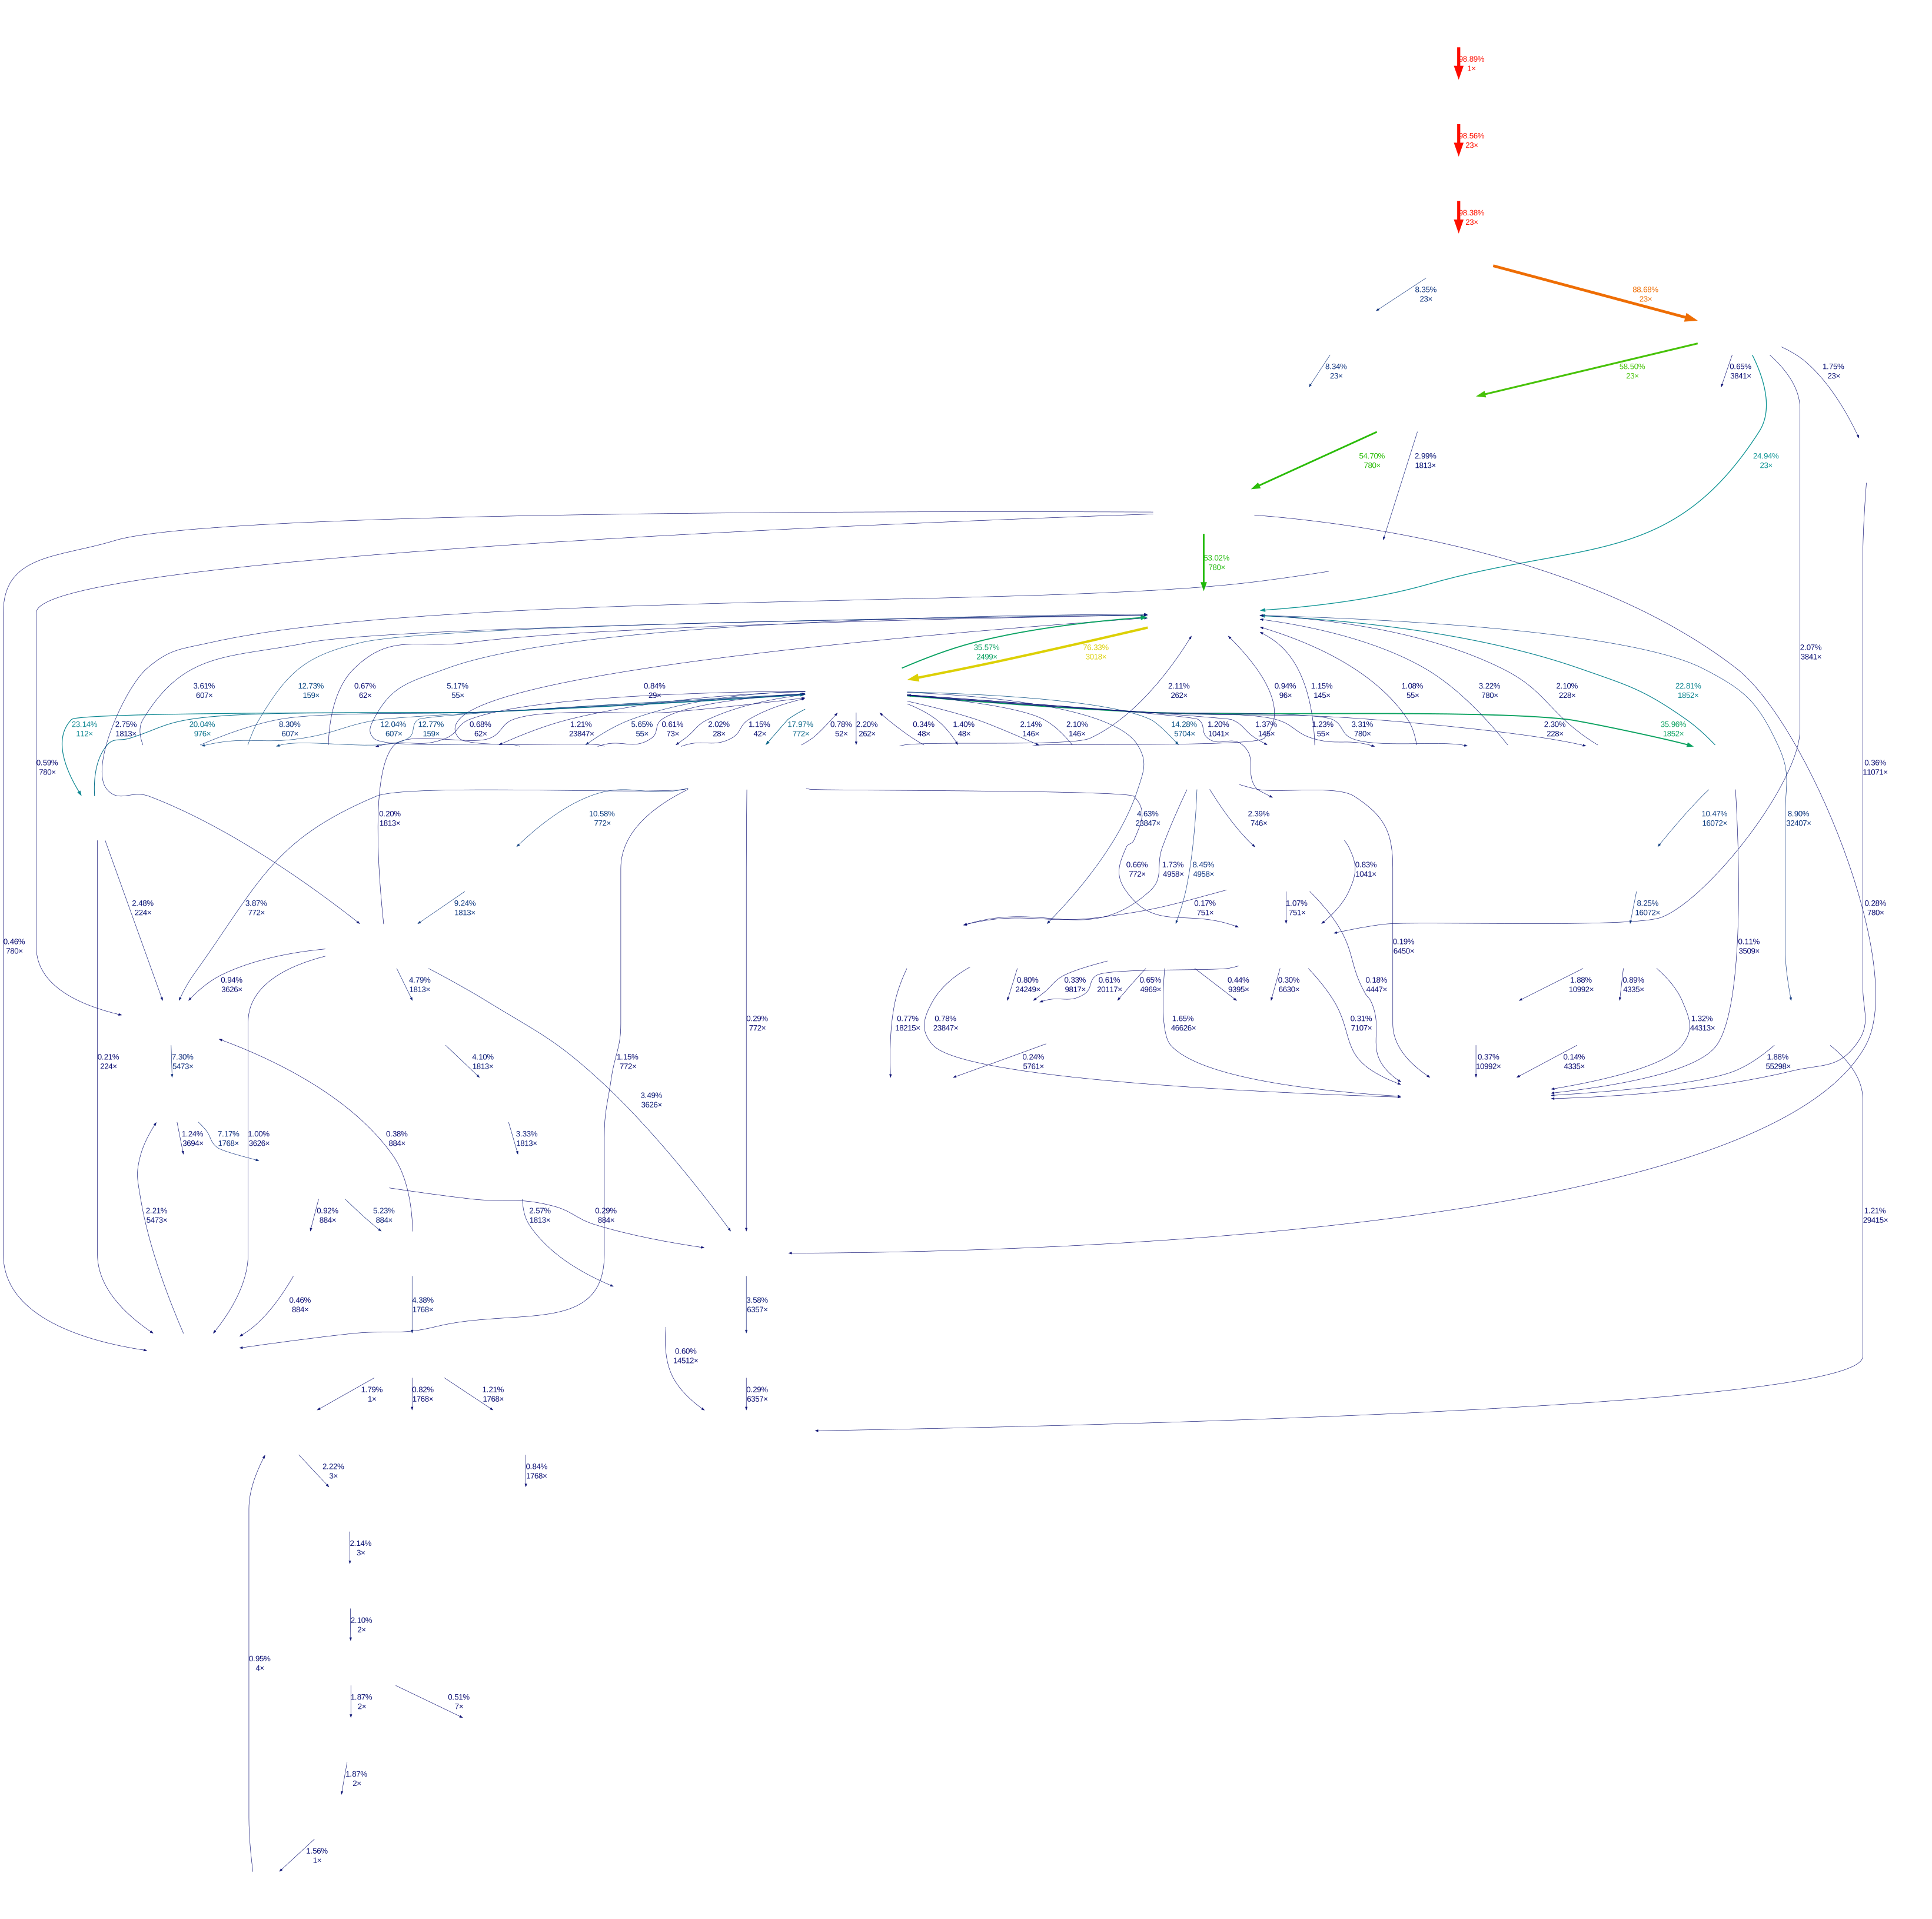
minimal problem statement: profiling a module or script muddies the profile with import-time computation. it would be nice to profile just a function
open problems: what to put in sys.argv[0]? (this is apparently already a problem for the proposal for python itself here: Support entrypoint references in -m · Issue #145495 · python/cpython · GitHub – personally I don’t care what value gets put there)
here’s a small script where I played around with the idea – and was able to generate much cleaner profiles than with -m:
import argparse
import cProfile
import sys

def main() -> int:
    parser = argparse.ArgumentParser()
    parser.add_argument('-e', required=True)
    parser.add_argument('-o', required=True)
    args, rest = parser.parse_known_args()

    prof = cProfile.Profile()
    modname, name = args.e.split(':')
    mod = __import__(modname, fromlist=[name])
    attr = getattr(mod, name)

    sys.argv[1:] = rest
    try:
        with prof:
            attr()
    finally:
        prof.dump_stats(args.o)

    return 0

if __name__ == '__main__':
    raise SystemExit(main())
(attached svgs are generated via):
# gprof2dot via `pip install yelp-gprof2dot`
python3 -m cProfile -o log.pstats -m pyflakes pyflakes && gprof2dot log.pstats | dot -Tsvg -o dashm.svg

python3 -m cProfileE -o log.pstats -e pyflakes.api:main pyflakes && gprof2dot log.pstats | dot -Tsvg -o dashe.svg