Aware that this is quite old but fixing this helped me understand how this projection works better. All that needs to change is the order of the ‘axes’ given. I say ‘axes’ in quotations because it’s a bit of a strange one; think of the ax.contourf(x_grid_xy, y_grid_xy, counts_xy.T, zdir=‘z’, offset=min(z), levels = 25, cmap=‘Reds’, zorder=0) line just flattening what a ax.contourf(x_grid_xy, y_grid_xy, counts_xy.T) plot would look like down to the xy plane. Thinking of it that way, it makes sense that the xz and yz projections look odd, as you’re taking the distributions and plotting them the same way again, and flattening them to the other axis (as if you were looking straight at the xz plane for example). To fix this, just swap around the order, so that the contourf plots would be covering the plane that you want to project them onto.
i.e. it should be:
ax.contourf(x_grid_xy, y_grid_xy, counts_xy.T, zdir=‘z’, offset=min(z), levels = 25, cmap=‘Reds’, zorder=0)ax.contourf(x_grid_xz, counts_xz.T, z_grid_xz, zdir=‘y’, offset=max(y), levels = 25, cmap=‘Greens’, zorder=0)ax.contourf(counts_yz.T, z_grid_yz, y_grid_yz, zdir=‘x’, offset=min(x), levels = 25, cmap=‘Blues’, zorder=0)
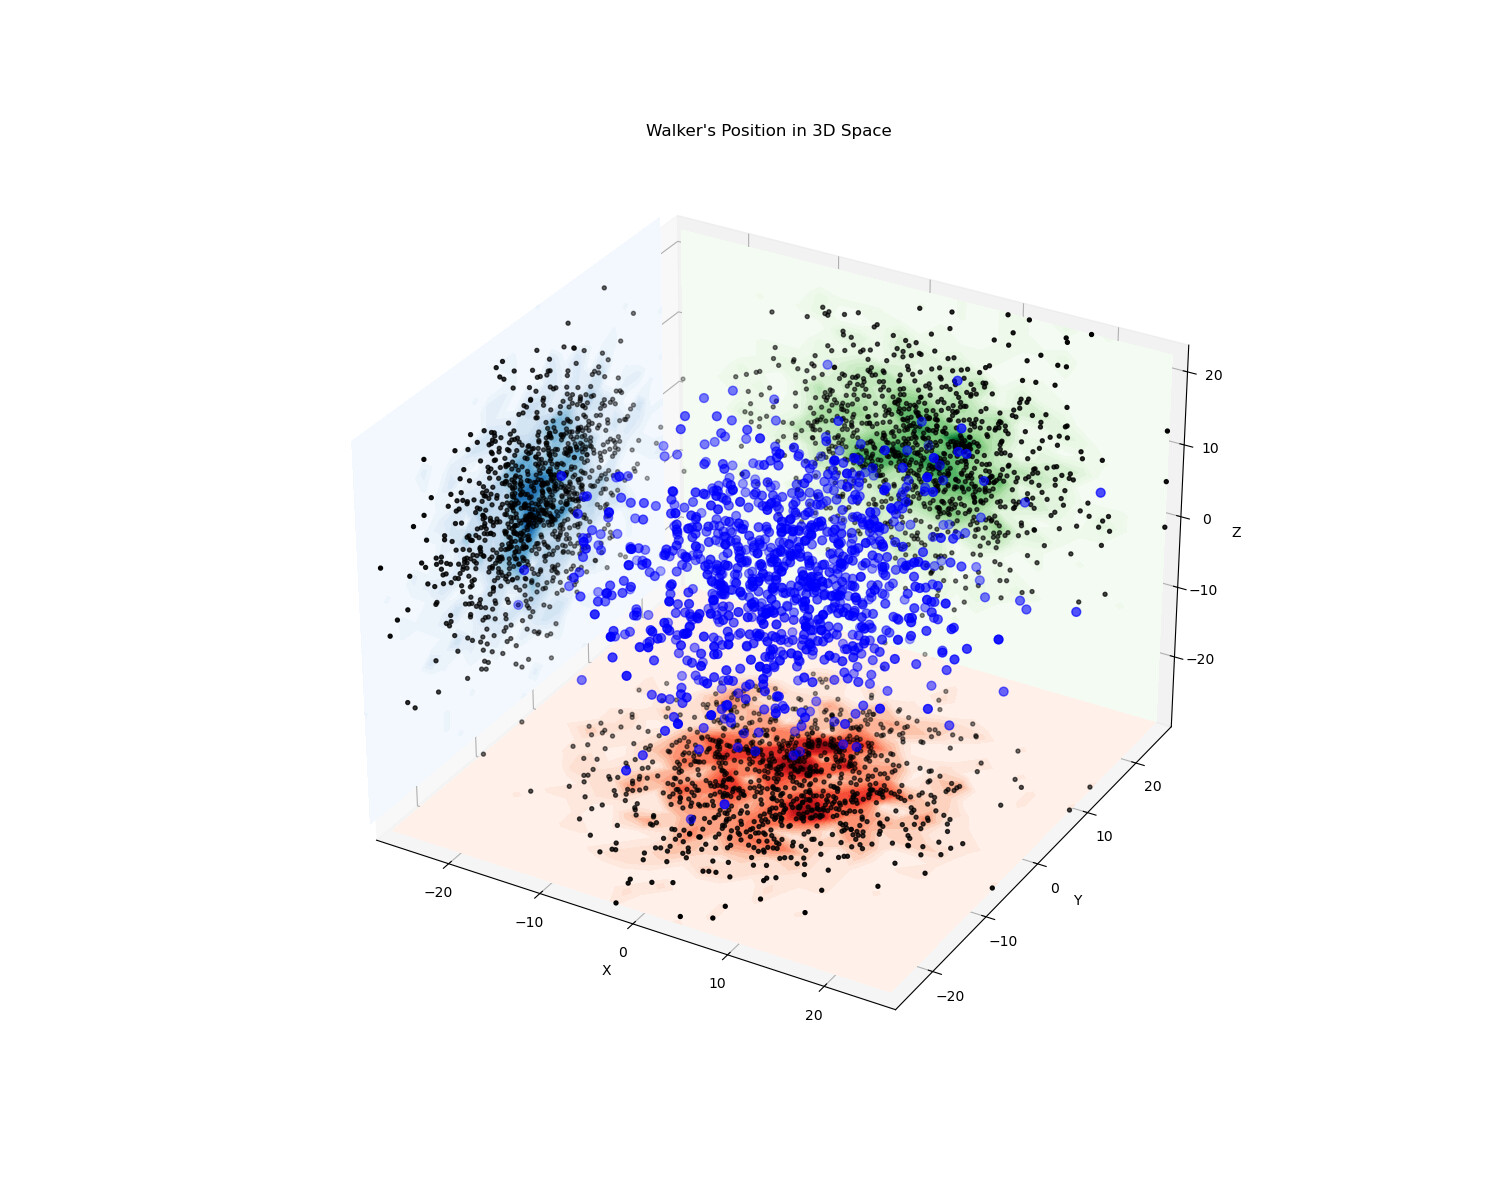
Hopefully the explanation makes sense, and sorry for the formatting! (haven’t posted here before!)