Create png Image from Coordinates

Hello All,

New to the forums here and I am pretty much a newbie who has tinkered with Python in the past, mostly for fun. However, I am doing some image based research and believe I have a good first application for Python and looking for some guidance. Please don’t laugh at how simple this will likely be for some of you!

Here is what I would like to do:

  1. Create an image of X,Y resolution
  2. Choose a background fill color based on RGB values
  3. I would like to color pixels at specific x,y locations from a csv file. The file would have x and y coordinate pixel locations
  4. I would like to choose the colour of these points to contrast with the background

If I could do that, I would be quite happy.

Other bells and whistles for me would be:

  1. Calculate the average x and y point and plot it a color of my choice.
  2. Calculate the standard deviation of x and y and plot it as an ellipse with the average point being the centroid. (Same color as the average point).
  3. Plot the 2x and 3x standard deviation

That’s it in a nutshell.

Any advice would be appreciated.

Thank you,

Eugene

There are many ways to do this, typically using libraries like numpy, scipy, pillow, imageio, skimage, opencv, pandas, and / or matplotlib.

One simple example:

import numpy, imageio
X,Y = 100,100
image = numpy.zeros((Y, X, 3), dtype=numpy.uint8)
image[50, 50, :] = (0xFF, 0xFF, 0xFF)
imageio.imwrite('output.png', image)

numpy can also calculate means and standard deviations. For typical plots matplotlib is probably the best starting point.

I think that’s my issue…too many ways to do this!

So matplotlib will easily plot and export as a png or other image?

I shall test out your code snippet this evening!

Thank you!

Yes, with matplotlib you can export a png file like this:

import numpy
import matplotlib.pyplot as plt
xs = numpy.array([10,20,30])
ys = numpy.array([40,50,60])
plt.scatter(xs, ys)
plt.savefig('plot.png')

Check the documentation for examples of ellipses based on standard deviations

By Eugene Liscio via Discussions on Python.org at 20Jun2022 20:17:

New to the forums here and I am pretty much a newbie who has tinkered
with Python in the past, mostly for fun. However, I am doing some image
based research and believe I have a good first application for Python
and looking for some guidance. Please don’t laugh at how simple this
will likely be for some of you!

Here is what I would like to do:

  1. Create an image of X,Y resolution
  2. Choose a background fill color based on RGB values
  3. I would like to color pixels at specific x,y locations from a csv file. The file would have x and y coordinate pixel locations
  4. I would like to choose the colour of these points to contrast with the background

If I could do that, I would be quite happy.

I’d use Pillow for this: Pillow (PIL Fork) 10.1.0 documentation
Create a new Image and do stuff to it.
I’d read the CSV file with the standard csv module:
csv — CSV File Reading and Writing — Python 3.12.1 documentation

Other bells and whistles for me would be:
5. Calculate the average x and y point and plot it a color of my
choice.

This is easy.

  1. Calculate the standard deviation of x and y and plot it as an ellipse with the average point being the centroid. (Same color as the average point).
  2. Plot the 2x and 3x standard deviation

This requires more math. You can almost certainly do this with the
statistics module and Pillow (I’ve not tried).

Have a look at the statistics module:

The approaches up to here use basic tools and you get to do the cool
stuff of figuring out how to draw the things you want.

If you don’t care about the internals, there are some libraries which
make a number of things somewhat trivial.

If you want to plot data, matplotlib and/or numpy and/or pandas may
help.
Statistics examples section here:
https://matplotlib.org/stable/plot_types/index.html
Typical approach may be to load the CSV data into a Pandas DataFrame:
https://pandas.pydata.org/pandas-docs/stable/reference/api/pandas.read_csv.html
and plot from it:
https://pandas.pydata.org/pandas-docs/stable/reference/api/pandas.DataFrame.plot.html

Cheers,
Cameron Simpson cs@cskk.id.au

Awesome, I have homework! Thank you all. I’ll start playing with the code and report back as best as I can.

Cheers!

Ok, so i was experimenting with this snippet of code (after installing Pycharm and getting modules installed). So, I can likely do a brute force method where I just put all the coordinates arranged in Excel and then copy paste into the code.

import numpy, imageio
X,Y = 1920,1080
image = numpy.zeros((Y, X, 3), dtype=numpy.uint8)
image[40, 10, :] = (0xFF, 0xFF, 0x0)
image[50, 10, :] = (0xFF, 0xFF, 0x0)
image[40, 20, :] = (0xFF, 0xFF, 0x0)
imageio.imwrite(‘output.png’, image)

However, I am guessing I need to call the csv module to read an Excel file? I am not going to pretend I undersatand exactly what is going on here, but I would want to read the Excel file coordinates into the

image[xcoord, ycoord, :] = (0xFF, 0xFF, 0x0)

What does the “:” do in the above line?

Thank you

By Eugene Liscio via Discussions on Python.org at 21Jun2022 02:10:

Ok, so i was experimenting with this snippet of code (after installing
Pycharm and getting modules installed). So, I can likely do a brute
force method where I just put all the coordinates arranged in Excel and
then copy paste into the code.

import numpy, imageio
X,Y = 1920,1080
image = numpy.zeros((Y, X, 3), dtype=numpy.uint8)
image[40, 10, :] = (0xFF, 0xFF, 0x0)
image[50, 10, :] = (0xFF, 0xFF, 0x0)
image[40, 20, :] = (0xFF, 0xFF, 0x0)
imageio.imwrite(‘output.png’, image)

So, sidestepping Pillow and going to NumPy? Ok.
The zeros function:
https://numpy.org/doc/stable/reference/generated/numpy.zeros.html

However, I am guessing I need to call the csv module to read an Excel file? I am not going to pretend I undersatand exactly what is going on here, but I would want to read the Excel file coordinates into the

The openpyxl module will read and write Excel:
https://openpyxl.readthedocs.io/en/latest/

The Pandas package has a read_excel() function like its read_csv()
function: each returns a DateFrame.

image[xcoord, ycoord, :] = (0xFF, 0xFF, 0x0)
What does the “:” do in the above line?

Are you familiar with Python slicing in normal Python lists? The
[a:b:c] syntax is a slice, indicating the portion of the array from
a through to b (inclusively and exclusively respectively) in steps
if c (default 1 i.e. all the elements - you could use 2 to get
every other element, etc).

NumPy array are very flexible things and use the Python slice syntax
to select various views of the NumPy array. In your example:
xcoord,ycoord, is a 2-tuple for the a part, and the b part is
empty.

In a regular Python sequence the empty b would mean the end of the
array, thus the slice gets all the elements from a onwards. In a NumPy
array and given your example, I’d take it to mean the remaining
domensions of the array shape, you you’d be left with the length-3 thing
at (xcoord,ycoord), which I expect is “a pixel”.

There’s a tutorial on NumPy array slicing here:
https://numpy.org/doc/stable/user/absolute_beginners.html#indexing-and-slicing

which should explain what is going on above. I would think (guessing)
that what you have is a 2-tuple of (xcoord,ycoord) with the empty part
meaning “all the array at that 2-tuple”, so your 3-value pixel because
your array has the shape (Y,X,3) from when you defined it.

I do notice that your shape is Y and then X, but your example above
seems to be xcoord then ycoord. You might have something swapped.
You could test this by setting xcoord higher than 1080 (i.e. out of
range for the y-ordinates) and seeing what numpy does.

Cheers,
Cameron Simpson cs@cskk.id.au
Basically this:

image[40, 10, :] = (0xFF, 0xFF, 0x0)

Is a shorthand (called slicing) for this:

image[40, 10, 0] = 0xFF # Red
image[40, 10, 1] = 0xFF # Green
image[40, 10, 2] = 0x0  # Blue

Typically that last index in the numpy array is 0 for red, 1 for green, 2 for blue for RGB images.

numpy uses row-major (C) layout by default (“the later index changes more rapidly”) so typically images use image[ycoord, xcoord], not image[xcoord, ycoord].

(If that bothers you, pillow hides all this in image.putpixel((x, y), (r,g,b)). But internally it’s the same.)


pandas.read_excel() (with openpyxl installed) is indeed the way to go for Excel files.

import pandas
dataframe = pandas.read_excel("example.xlsx")
xcoords = dataframe["Your X coordinates column name here"]
ycoords = dataframe["Your Y coordinates column name here"]

Basically:

  • numpy is the low level foundation for almost all image processing in Python.
  • imageio is the foundation for reading and writing image files.
  • Other libraries often also use numpy and imageio internally.
  • pandas is for Excel-like table functionality. (openpyxl is the Excel backend.)
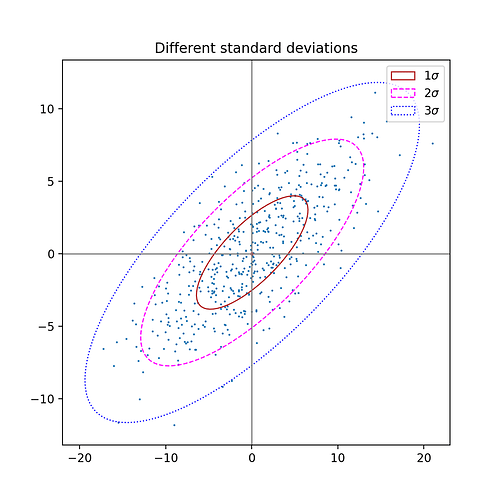
  • matplotlib is for plotting. If you want to create typical charts, scatter plots, etc. as described above, there’s no need to do it pixel by pixel yourself. matplotlib is the way to go, as this example demonstrates.
1 Like

This sound like a great first application, Eugene.

Since you’ve started with numPy, you’ll be able to step up to OpenCV since OpenCV uses NumPy arrays as its framework for images. This will give you some library functions for drawing shapes, combining and modifying images, etc. Or you can go with Pillow, as @cameron recommended.

Pillow and OpenCV are both good choices. These are the ones I come across most in image work (plus Scikit-Image to a slightly lesser degree), and the best one to learn depends on where you’d like to end up. You mentioned ‘image based research’, so you’ll probably want to do some comparing of the packages available and then focus on the one that suits your goals. With apologies to anyone who has a different favorite from these two, here’s a quick comparison of Pillow and OpenCV:

  • SPEED: OpenCV appears to be faster–and sometimes MUCH faste than PILLOW to a degree that will add up when processing large image libraries or intensive computation on large images. Image analysis could easily involve such heavy lifting. Preparing a library for Deep Learning also comes to mind since that often involves processing several thousand images or more many times over at VGA resolution or higher.

  • POWER vs SIMPLICITY: Pillow’s docs home page says that “Pillow is the friendly PIL fork” and has “fairly powerful image processing capabilities”. I haven’t used Pillow so am not qualified to offer comparisons but I’ve done a few commercial projects with OpenCV and found that OpenCV is “quite powerful–and probably very powerful” (whatever that might mean to someone else). Unleashing that power also requires some intensive study to understand its functions and how to apply them. At first glance, it appears that Pillow might trade some power for ease of use.

  • MATURITY: OpenCV was released in 2000. Pillow’s predecessor PIL (Python Imaging Library) was released in 1995. So they’re both pretty comparable here. Intel founded the OpenCV project and it was developed & supported with research at many well-known engineering universities. The library functions and documentation often read like a graduate student project (which it probably was), reflecting its academic and R&D roots. OpenCV’s founding scientist/engineer has remained continuously active in it. PIL and Pillow’s history appears to be a bit less transparent and available, unfortunately. Activity on GitHub shows about twice the amount of activity for OpenCV. Due it its age, OpenCV has many different coding styles embedded in it as practices evolved over the years (speaking from first-hand experience). Pillow is slightly older and quite possibly has such “features” also, but I don’t want to assume without direct knowledge.

    • perhaps someone with balanced experience in both libraries can offer some impartial insight…
  • IMAGE FORMAT: OpenCV uses numPy arrays as images, so natively interfaces with all numPy array functions. PIL/Pillow prefers its own image format. There are probably advantages to this but for me, the convenience of working with images as numPy arrays has been valuable for the community support of numPy alone. On the other hand, you can manipulate Pillow images with numPy with a conversion, but at the cost of some overhead.

  • COLOR ENCODING: For historical reasons, OpenCV uses BGR (rather than RGB), which can trip you up at times but is fairly easy to detect because the output coloring goes wonky when you forget. Read and write functions automatically convert back and forth when loading from the RGB universe or writing an image back into it. As mentioned, Pillow has a similar situation with its PIL format, requiring a conversion to import and export to PIL format.

This seems like a pretty good survey of these two imaging libraries, so we’ll call this good enough for now. If you’re feeling a little adventurous, you can give both Pillow and OpenCV a test drive using this introductory guide that covers both packages.

Postscript...

This Reddit post seems to sum up the difference well:

Pillow is an image manipulation/processing library while OpenCV is a computer vision library.

While there is certainly a lot of overlap (i.e. OpenCV contains a fair bit of image processing functionality) they are vastly different in scope.

To make an extreme simplification, you use Pillow if you want to cut and resize images, and maybe do a bit of filtering, and you use OpenCV when you are building a robot that is trying to “see” things.

Personally, as someone who use OpenCV more or less daily, but have never touched Pillow, I would probably use OpenCV for things Pillow does, simply because I am familiar with it. However, unless you have specific reasons to use OpenCV, I would stay away since it can be extremely annoying and over complicated at times.

I agree 100% with the comments in this Reddit thread about OpenCV. My first project with OpenCV was a simple imaging application that soon opened up to barcode and squarecode detection, tracking, and reading. It was the perfect gradient to come up to speed with OpenCV. I also do machine vision for robotics and inspection systems using purpose-built image software from the robot and camera system manufacturers and I can use OpenCV to do anything that these high-end commercial vision systems do–and much more.

Learning OpenCV took a lot of effort and was anything but easy. But OpenCV puts many powerful imaging functions at your fingertips within a single package.

For example, OpenCV will locate objects in 3D space and return a Cartesian XYZ coordinate system for them. It also has around 150 different color spaces, so you can manipulate images by hue, gamma, and dozens of other chromatic parameters. Happily, you can start with Pillow and…

from opencv import "any single function that you would like to learn about"

Happy Imaging to you!!

3 Likes

I think it’s universally accepted that numpy is the general foundation, and learning its basics at least a little bit will 100% not be wasted time in any case.

pillow, opencv, skimage etc. are then all good choices if more functionality is needed, each with their slightly different strengths, and you should not hesitate to use them if they help or are of interest.

But I get the feeling that the poster here might be better helped by matplotlib and pandas first. It seems they would easily allow everything in the listed goals out of the box, including bells and whistles without having to reinvent the wheel pixel by pixel. (Nothing against reinventing the wheel, if there’s time and interest of course. :slight_smile: )

Since I have a day job, I am hitting this little by little in the evenings or as time permits. I thank you all for this valuable input and will post progress as I move forward on this mini project.

Much appreciated!

1 Like

@eliscio, I re-read your Original Post and realized I may have overlooked an important point: are you talking about images as in graphic images or images as in photographs? It seems to be graphics.

Your description sounds like an XY scatter plot and the ellipses and StdDeviation for linear regression. Is it?

If you’re planning to stay in the mathematical domain, then numPy and a plot package will serve you well. Can’t go wrong with matplotlib.pyplot.

Here’s a matplotlib.pyplot sample from the page that Peter linked of what it sounds like you’re looking for:

image = numpy.zeros((Y, X, 3),<dtype>))
image[Ycoord, Xcoord, :] = (0xFF, 0xFF, 0x0)

That’s exactly correct. You can see it in the image instance. It’s a fixed X and Y with “all Z”. In images, Z is the color (3 for RGB), so…

#not code; just invoking monospace for columns
Z1 = R = 0xFF (255) #Full Red
Z2 = G = 0xFF (255) #Full Green
Z3 = B = 0x0  (0)   #No Blue

I capitalized the “inverted” graph coordinates to underscore what Peter and Cameron said about Row-first and Y-first coordinates. Basically, the origin is at top left, X goes to the right as normal, and Y goes down…and the coordinate order goes Down then Over (I’m still only semi-used to that after so many years of graphing data the common way. :yum:)

Since a CSV file is just a text file and not a fancy Excel native file format, you can read your XY data from a csv file by just opening it directly with Python and reading the lines. You can read the lines one at a time and plot the coordinates right away or you pick up all of the lines at once.
Which approach you take depends on how you process the coordinates (singles vs. batch). Single is sort of a “clockwork” tick-tock style. Batch tends to be smoother, so:

path_and_filename = 'C:/data/coords.csv'
with open(path_and_filename) as coordFile:
    coordList = [line for line in coordFile]
for line in coordList:
    Xcoord = float(line[0])
    Ycoord = float(line[2])
    <PLOT CODE HERE>

Your csv file should contain one coordinate pair X,Y per line. This will read all of your coordinates in as a list. Note the float() that’s needed because the csv values are loaded as strings. This can be coded more concisely but the above strikes a balance between brevity and transparency.

Actually, it’s both…what I have are a number of CCTV images where I have asked people to mark specific pixel locations. I now want to overlay all the participant pixel coordinates back onto the original image. However, I am fine plotting the pixel coordinates in a separate png or jpg image and then using Photoshop adjust the opacity over the original image.

From an analysis point of view, the plot that you just showed above would be something similar to what I would want showing average and standard deviations, but in the same way, overlay that on top of the original image…if the coordinates are in the right location, Photoshop will take care of that for me…I think.

This brings up another question…I thought that I would paint the background a unique color which is shown in the code above, but in truth, I really only need the coordinate locations with a transparent background. How do you handle transparency channels in Python?

Thank you,

Eugene

I have are a number of CCTV images

In that case opencv might be the right direction after all.

How do you handle transparency channels in Python?

With numpy you would simply use four numbers (RGBA) instead of three (RGB). Probably BGRA in opencv.
You can of course also load the CCTV images (image = imageio.imread('cctv.png') and draw onto them directly.

With matplotlib you might be content with plt.savefig('plot.png', transparent=True) or plt.imshow(image, zorder=0).

overlay that on top of the original image

This is fairly simple in OpenCV (although only after some study and practice).

Doing it in PhotoShop is a great option since the better one understands the process, the better one’s chances of successfully automating it. At some point, you’ll probably be able to “port” the process over to Pillow or OpenCV. Pillow appears to be able to overlay images. Numpy will let you do it for sure.

In Numpy (without much code since that’s a bit out of context):

  1. Size the plot image the same as the photo image.
  2. In the plot, set the RGB values to zero anywhere color_value = 255.
    • Full R + Full G + Full B = white
    • You’ll probably have to add the RGB values together for each pixel and look for
      color_sum = 765 to avoid zeroing out pure reds, greens, and blues.
    • OPTION: set alpha for all white pixels (R+G+B = 765) to 0.
  3. a. Add the RGB|A arrays of the photo and plot together. (‘|’ = optional).
    • the plot will show up with a color shift because the pixel color values were added. This might produce a nice “ghost” effect by accident, but that’s going to depend on the darkness of the photo and the lightness of the plot’s lines.

To preserve plot colors:

  1. b. Create a mask with the plot image array (pixels with color_value < 250 = 1)
  2. pass the photo through the plot mask (multiply the image array and the Mask array).
  3. Add the images together as in 3a above.

Of course, you can do this process with ‘Replace Color’ in Photoshop (and presumably Gimp or Inkscape), but processing a batch is where the effort to automate pays huge dividends.

1 Like

Thanks Leland. I am honestly out of my league here but I am taking small steps to understand this all. Once I create the code to create the pixels and images, I’ll proceed to plot the averages and standard deviations, then I’ll try to make this a bit more automated.

Cheers!

1 Like