Here is a piece of code I generated using Chatgpt. I use python to import local data for filtering calculations and generate charts through the Dash interface in the browser. Then export the data to local.
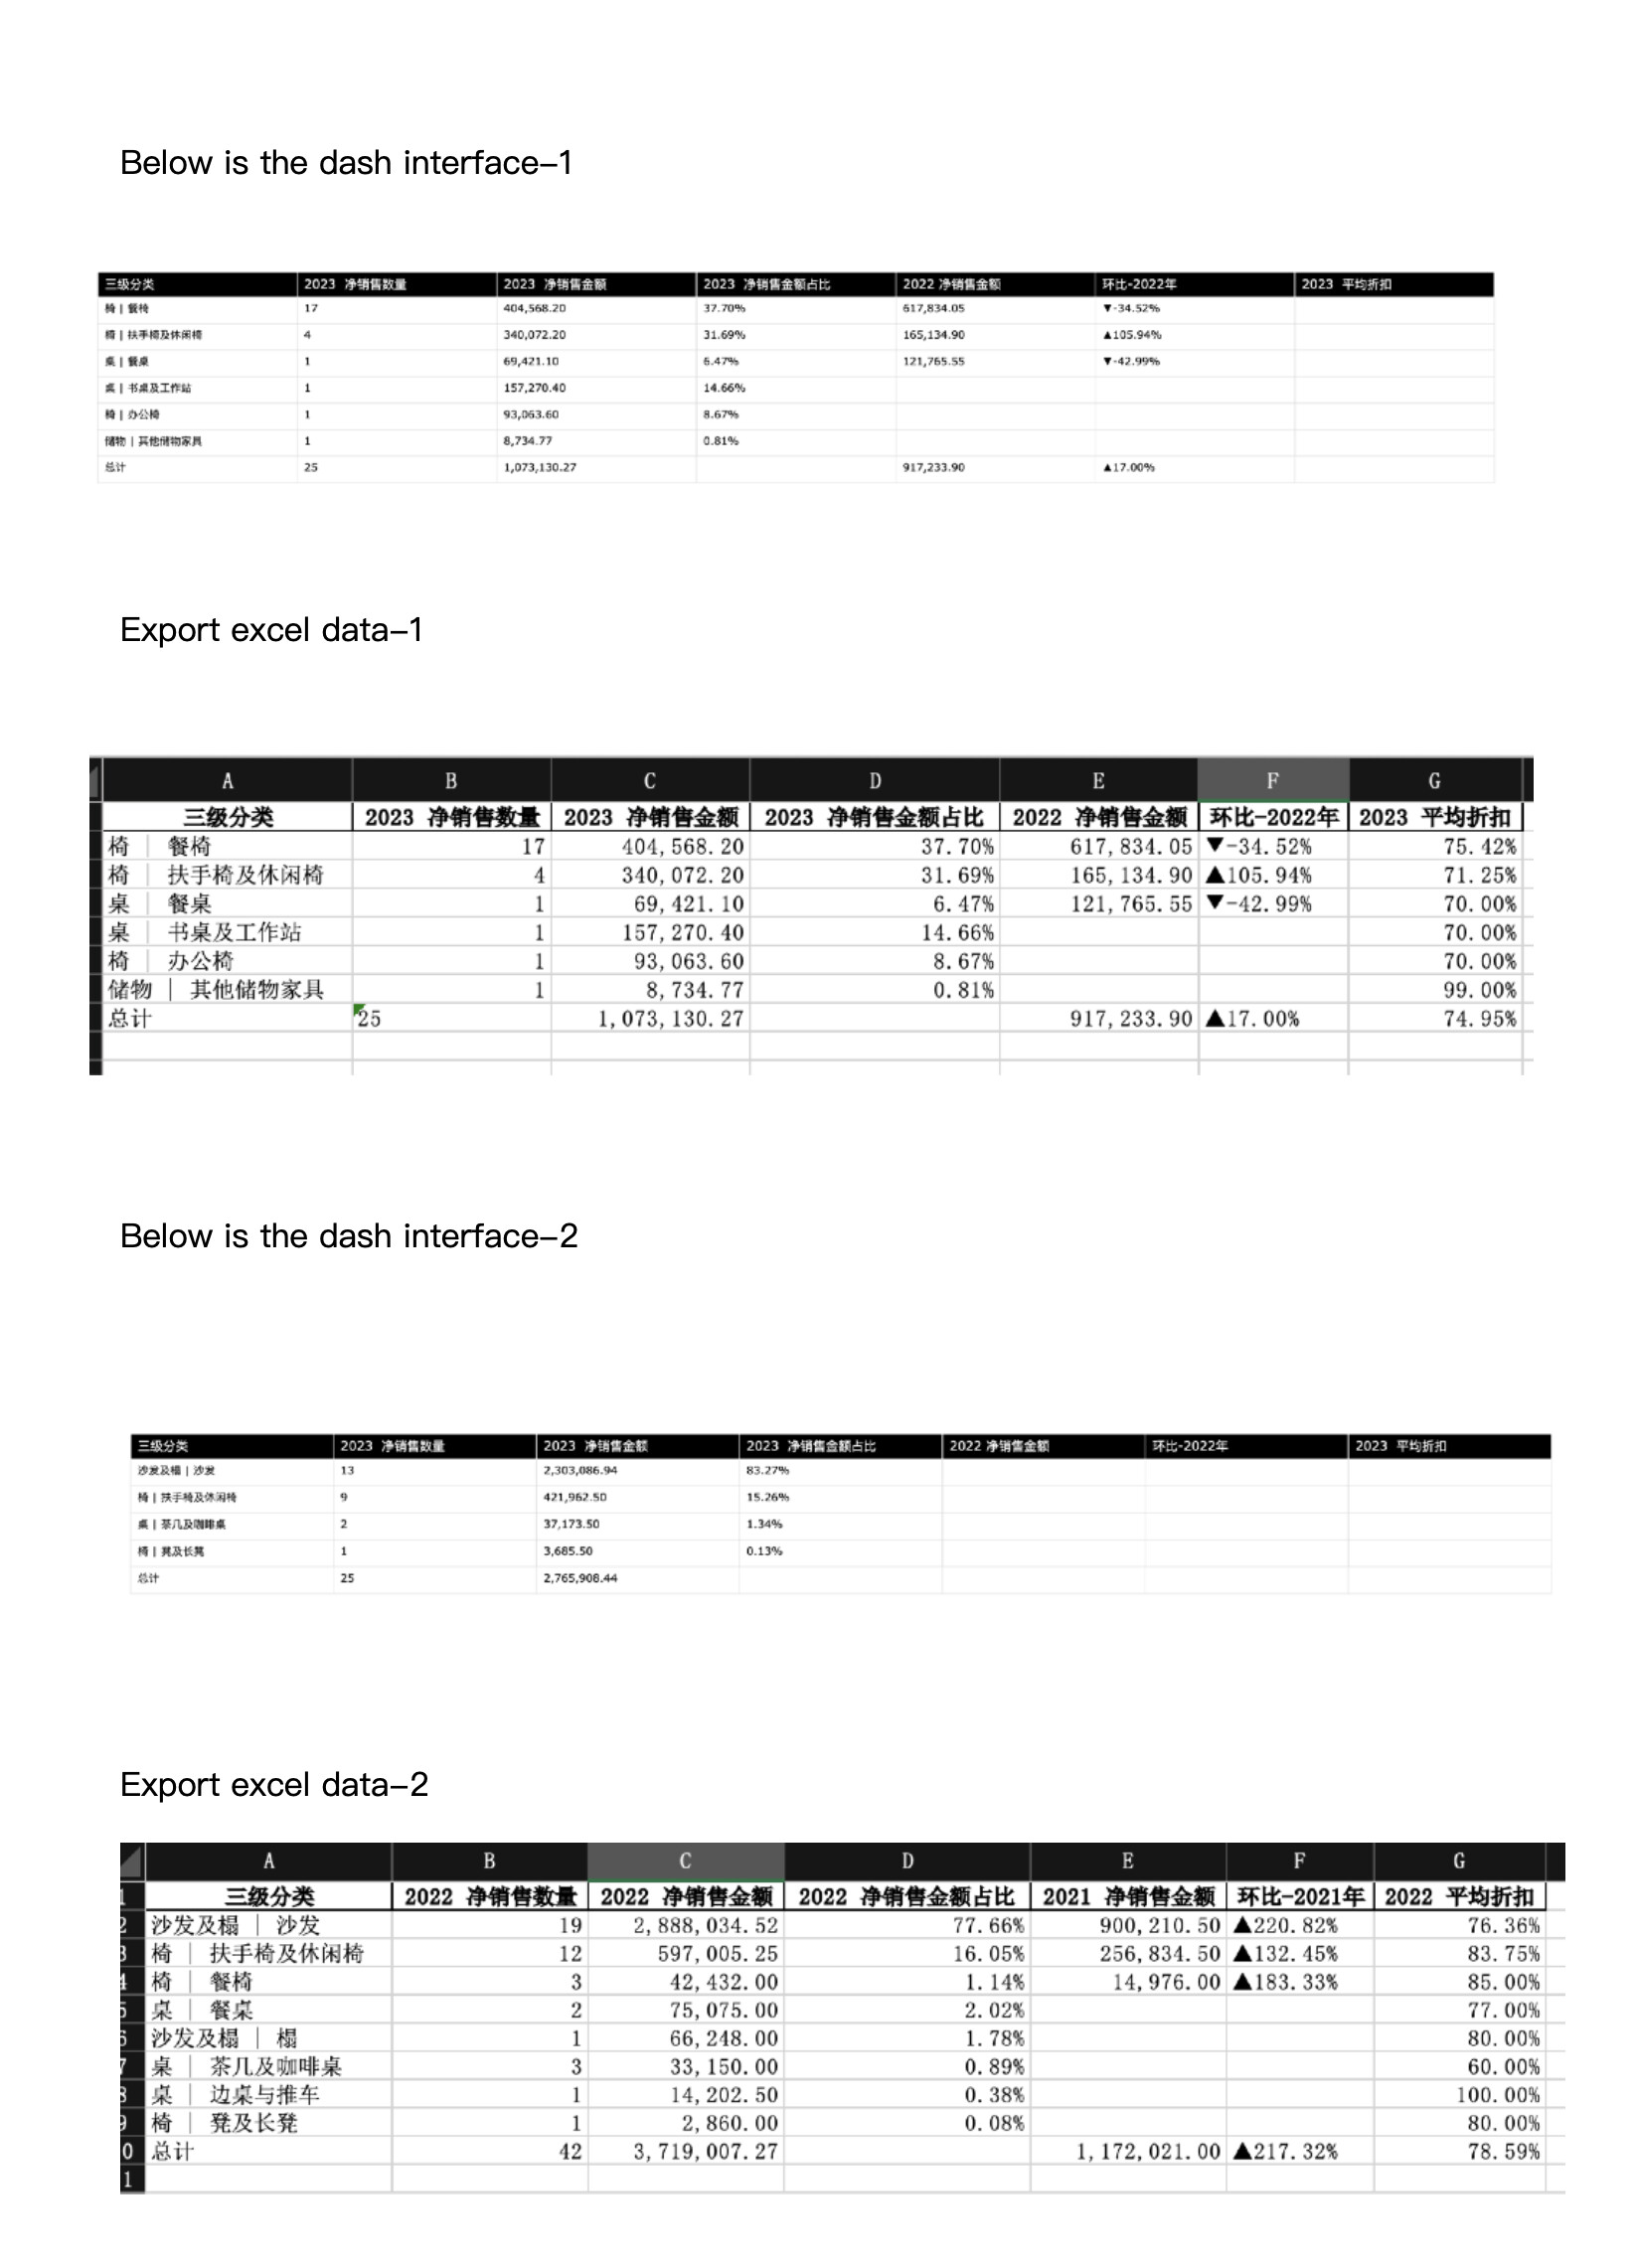
There is something wrong with this code. After calculating the results, under a specific brand, the data transmission of the selected annual average discount, month-on-month - previous year, and previous year net sales columns in the dash interface chart will be omitted or omitted. Shows blank.
But it can be displayed correctly in the exported local excel. This problem arises when the number of third-level classifications for the corresponding brand in a particular year is small.
The errors mainly occur in the 2023 year. The original data has been checked and there are no errors.
读取Excel数据,不转换日期
df = pd.read_excel('销售数据24.xlsx')

# 解析日期字符串
df['年月'] = pd.to_datetime(df['年月'], dayfirst=True, format='%Y%m')
# 添加年-季度列
def parse_date_string(date):
  year = date.year
  month = date.month
  quarter = (month - 1) // 3 + 1
  return f"{year}-Q{quarter}"
df['年-季度'] = df['年月'].apply(parse_date_string)

# 创建Dash应用
app = dash.Dash(__name__)

# 设置CSS样式
title_style = {'font-family': 'SimHei, sans-serif'}
label_style = {'font-family': 'SimHei, sans-serif'}


# 创建Dash布局
app.layout = html.Div([
  html.H1('销售数据可视化', style={'text-align': 'center', **title_style}),

  html.Label('选择产品分类', style=label_style),
  dcc.Dropdown(
      id='category-dropdown',
      options=[{'label': c, 'value': c} for c in df['三级分类'].unique()],
      value=df['三级分类'].unique()[0],
      multi=True,
  ),

  html.Label('选择品牌', style=label_style),
  dcc.Dropdown(
      id='brand-dropdown',
      options=[],
      value=[],
      multi=True,
  ),

  html.Label('选择销售明细', style=label_style),
  dcc.Dropdown(
      id='item-dropdown',
      options=[],
      value=[],
      multi=True,
  ),

  html.Label('选择端口', style=label_style),
  dcc.Dropdown(
      id='port-dropdown',
      options=[{'label': 'All', 'value': 'All'}] + [{'label': p, 'value': p} for p in df['端口'].unique()],
      value='All',
  ),

  html.Label('选择年份', style=label_style),
  dcc.Dropdown(
      id='year-dropdown',
      options=[{'label': str(year), 'value': year} for year in range(df['年月'].min().year, df['年月'].max().year+1)],
      value=[],
      multi=True
  ),

  dcc.Graph(id='sales-graph0'),
  dcc.Graph(id='sales-graph12'),
  dcc.Graph(id='sales-graph1'),
  dcc.Graph(id='sales-graph3'),
  dcc.Graph(id='sales-graph4'),
  dcc.Graph(id='sales-graph2'),


  html.Div(
      className='row',
      style={'display': 'flex', 'flex-wrap': 'wrap'},
      children=[
          html.Div(
              className='col',
              style={'flex': '1 0 21em', 'margin': '5px'},
              children=[
                  dcc.Graph(id='sales-graph6')
              ]
          ),
          html.Div(
              className='col',
              style={'flex': '1 0 21em', 'margin': '5px'},
              children=[
                  dcc.Graph(id='sales-graph5')
              ]
          ),
          html.Div(
              className='col',
              style={'flex': '1 0 21em', 'margin': '5px'},
              children=[
                  dcc.Graph(id='sales-graph8')
              ]
          ),
          html.Div(
              className='col',
              style={'flex': '1 0 21em', 'margin': '5px'},
              children=[
                  dcc.Graph(id='sales-graph9')
              ]
          )
      ]
  ),


  dcc.Graph(
    id='sales-graph7',
    figure={
      'data': [],
      'layout': {}
    }
  ),

  dcc.Graph(
    id='sales-graph14',
    figure={
      'data': [],
      'layout': {}
    }
  ),

  dcc.Graph(
    id='sales-data-table',
    figure={
      'data': [],
      'layout': {}
    }
  ),

  dcc.Graph(
    id='sales-data-table13',
    figure={
      'data': [],
      'layout': {}
    }
  ),


])


@app.callback(
  Output('sales-data-table13', 'figure'),
  [Input('year-dropdown', 'value'), Input('brand-dropdown', 'value')]
)
def update_sales_data_table(year_list, brand):
  if year_list is None or len(year_list) == 0:
      return go.Figure()

  years = ", ".join(str(year) for year in year_list)
  year = int(year_list[0])
  prev_year = year - 1

  selected_year = str(year)

  filtered_df = df[df['年月'].dt.year == year]

  if brand:
      if isinstance(brand, str):
          brand = [brand]
      filtered_df = filtered_df[filtered_df['品牌'].isin(brand)]

  total_qty = filtered_df['净销售数量'].sum()
  total_amt = filtered_df['净销售金额'].sum()
  total_qty_formatted = '{:,.0f}'.format(total_qty)
  total_amt_formatted = '{:,.2f}'.format(total_amt)

  sales_qty = filtered_df.groupby('三级分类')['净销售数量'].sum().reset_index()
  sales_qty.rename(columns={'净销售数量': f'{selected_year} 净销售数量'}, inplace=True)

  sales_amt = filtered_df.groupby('三级分类')['净销售金额'].sum().reset_index()
  sales_amt.rename(columns={'净销售金额': f'{selected_year} 净销售金额'}, inplace=True)

  sales_data = pd.merge(sales_qty, sales_amt, on='三级分类', how='inner')

  sales_data[f'{selected_year} 净销售金额占比'] = sales_data[f'{selected_year} 净销售金额'] / sales_data[f'{selected_year} 净销售金额'].sum()

  sales_data = sales_data.sort_values(f'{selected_year} 净销售金额', ascending=False).head(50)

  if brand:
      prev_year_filtered_df = df[(df['年月'].dt.year == prev_year) & (df['品牌'].isin(brand))]
  else:
      prev_year_filtered_df = df[df['年月'].dt.year == prev_year]
  prev_year_sales_amt = prev_year_filtered_df.groupby('三级分类')['净销售金额'].sum().reset_index()
  prev_year_sales_amt.rename(columns={'净销售金额': f'{prev_year} 净销售金额'}, inplace=True)

  if prev_year_sales_amt.empty:
      sales_data[f'{prev_year} 净销售金额'] = np.nan
  else:
      sales_data = pd.merge(sales_data, prev_year_sales_amt, on='三级分类', how='left')
      sales_data = sales_data.sort_values(f'{prev_year} 净销售金额', ascending=False)

  prev_year_total_sales_amt = prev_year_filtered_df['净销售金额'].sum()
  percentage_change = (total_amt - prev_year_total_sales_amt) / prev_year_total_sales_amt
  percentage_change_formatted = '▲{:.2%}'.format(percentage_change) if percentage_change > 0 else ('▼{:.2%}'.format(percentage_change) if percentage_change < 0 else '')

  sales_data[f'环比-{prev_year}年'] = (sales_data[f'{selected_year} 净销售金额'] - sales_data[f'{prev_year} 净销售金额']) / sales_data[f'{prev_year} 净销售金额']
  sales_data[f'环比-{prev_year}年'] = sales_data[f'环比-{prev_year}年'].apply(lambda x: '▲{:.2%}'.format(x) if x > 0 else ('▼{:.2%}'.format(x) if x < 0 else ''))

  sales_data[f'{selected_year} 净销售金额'] = sales_data[f'{selected_year} 净销售金额'].apply(lambda x: '{:,.2f}'.format(x))
  sales_data[f'{selected_year} 净销售金额占比'] = sales_data[f'{selected_year} 净销售金额占比'].apply(lambda x: '{:.2%}'.format(x))
  sales_data[f'{prev_year} 净销售金额'] = sales_data[f'{prev_year} 净销售金额'].apply(lambda x: '{:,.2f}'.format(x) if not pd.isnull(x) else '')

  sales_data.loc[len(sales_data)] = ['总计', total_qty_formatted, total_amt_formatted, '', '', percentage_change_formatted]
  sales_data.loc[len(sales_data) - 1, f'{prev_year} 净销售金额'] = '{:,.2f}'.format(prev_year_total_sales_amt)

  filtered_df['明细折扣'] = pd.to_numeric(filtered_df['明细折扣'], errors='raise')

  detail_discounts = filtered_df.groupby('三级分类')['明细折扣'].mean().reset_index()
  detail_discounts.rename(columns={'明细折扣': '平均明细折扣'}, inplace=True)

  avg_discounts = filtered_df.groupby('三级分类')['明细折扣'].mean().reset_index()
  avg_discounts.rename(columns={'明细折扣': f'{selected_year} 平均折扣'}, inplace=True)

  sales_data[f'{selected_year} 平均折扣'] = sales_data['三级分类'].map(avg_discounts.set_index('三级分类')[f'{selected_year} 平均折扣']).apply(lambda x: '{:.2%}'.format(x))

  total_avg_discount = filtered_df['明细折扣'].mean()
  total_avg_discount_str = '{:.2%}'.format(total_avg_discount)

  sales_data.loc[len(sales_data) - 1, f'{selected_year} 平均折扣'] = total_avg_discount_str

  # Adjust column_widths to exclude the "平均折扣" column
  column_widths = [1, 1, 1, 1, ]  # Remove the last 1 for the "平均折扣" column


  # Update table Figure Creation
  fig = go.Figure(data=[
      go.Table(
          header=dict(
              values=[col.replace(selected_year, f'{selected_year} ') for col in sales_data.columns],
              fill=dict(color='black'),
              font=dict(color='white', size=14),
              align='left'
          ),
          cells=dict(
              values=[sales_data[col] if col != '三级分类' else [textwrap.fill(str(category), 10) for category in sales_data[col]]
                      for col in sales_data.columns],
              fill=dict(
                  color=[
                      ['white' if (j == len(sales_data) - 1) else 'rgba(0,0,0,0)' for j in range(len(sales_data))]
                      for i in range(len(sales_data.columns))
                  ],
              ),
              align='left',
              font=dict(
                  size=[12] * (len(sales_data) - 1) + [16],
                  color=['black'] * (len(sales_data) - 1) + ['white']
              ),
              height=30,
              line=dict(color='rgba(211, 211, 211, 0.5)', width=1)
          ),
          columnwidth=column_widths  # 设置相对列宽度
      )
  ])

  fig.update_layout(
      title={
          'text': f'分类年度销售数据<br>年份: {years}-{brand[0] if brand else ""}',
          'x': 0.5,
          'y': 0.98,
          'font': {'size': 16}
      },
      margin=dict(l=81, r=81, t=80, b=80),
      height=1200
  )

  directory = "/Users/Aron-Y/Desktop/python analysis"  # 设置您希望保存文件的目录路径
  os.makedirs(directory, exist_ok=True)  # 确保目录存在,如果不存在则创建

  file_name = f"{directory}/{selected_year}年{brand[0] if brand else ''}-分类销售及折扣数据.xlsx"
  sales_data.to_excel(file_name, index=False)


  return fig
operation result
The reason for the error may be that when calculating the average discount, the number of third-level categories under a specific brand and year is insufficient, resulting in an error in the calculation of the discount data group agg or a null value.
Since my python foundation is very weak, I can’t solve this error well. If you can find the reason for the error, please share it with me, thank you very much