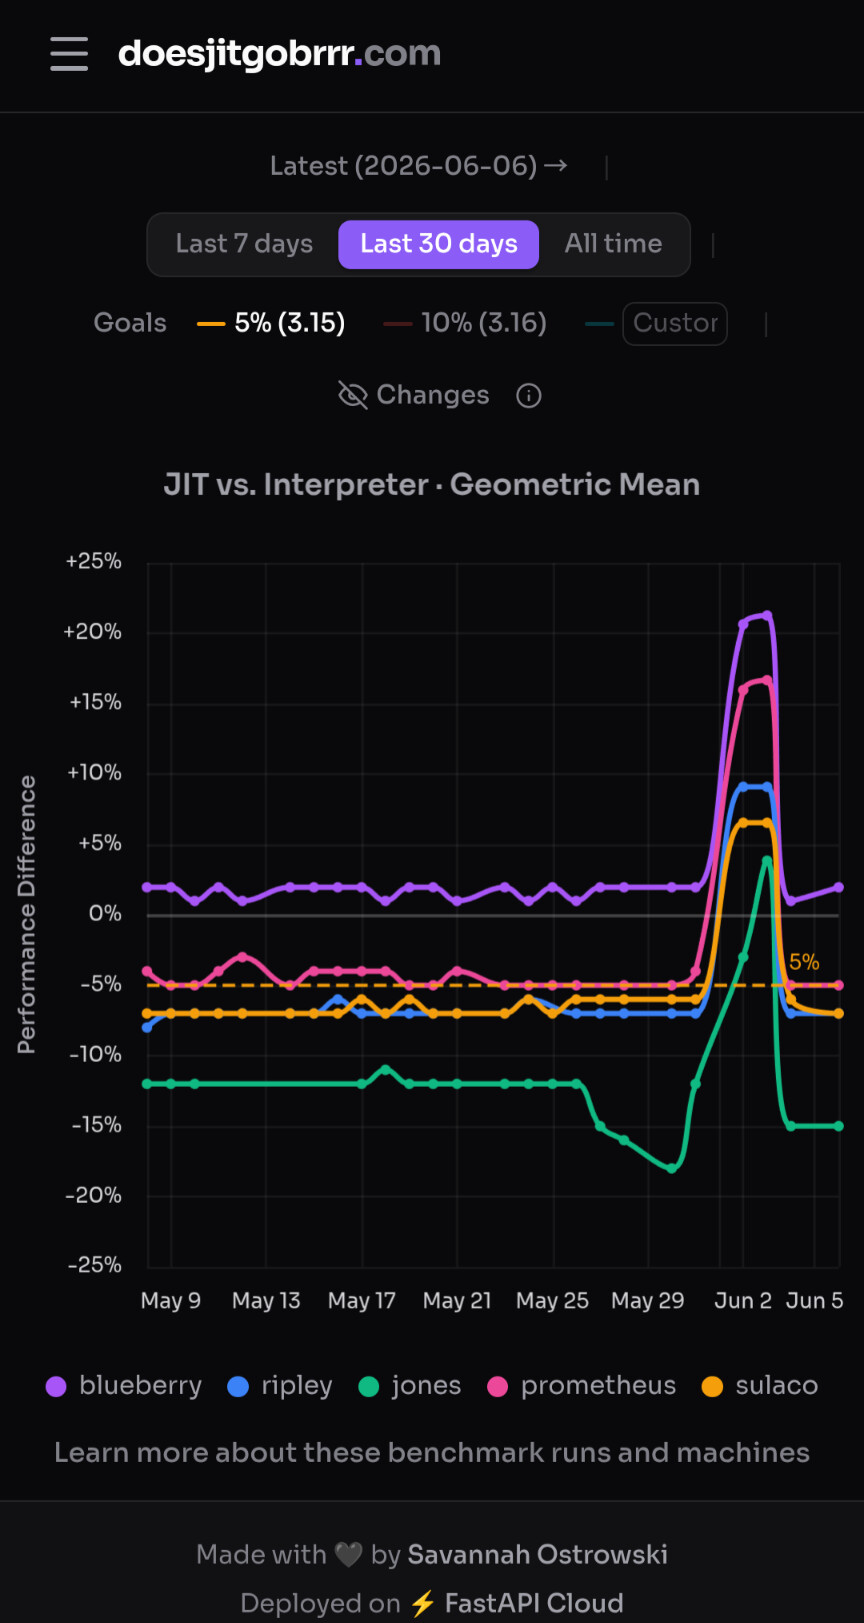
Thomas’s benchmark is severely outdated by now. Check out https://www.doesjitgobrrr.com/. The JIT does achieve >5% geomean (in fact, > 10% in some cases) on systems.
I clicked the link and I might have overlooked something but it was not immediately clear to me whether +x% or -x% is the goal. Maybe this could be clarified (“higher is better” or something like that) so it’s obvious at a glance whether the JIT indeed goes brrr or not.
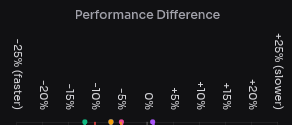
This is also not helped by the fact that the axis mixes up performance (should increase) and runtime (should decrease); according to the plot, the desirable direction is “-x% Performance”, which is of course nonsensical, even if the axis has a “(faster)” annotation on that side.
I don’t think it’s nonsensical. “Less time compared to baseline”, which means -baseline is one way to state things. I think it just depends on which way you prefer the graph to look.
Yeah, I’ve heard some comments before about people not liking the visualization. The site has actually gone through a couple iterations now (making this look half reasonable on mobile was non-trivial) but, this was what seemed to make the most sense for the people that look at that dashboard most often for their work.
That said, it is indeed open source. Contributions and discussion about improvements are welcome
What makes this confusing is that the graph shows performance differences, with JIT values presented relative to interpreter performance. This means that positive values should indicate better performance:
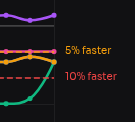
Flipping the graph vertically would make it more intuitive and better aligned with the values shown on the right side, which are themselves confusing, as 10% appears lower than 5%: