I am trying to fit FTIR spectra with other reference spectra.
Input file path spectra_path = ‘’
**dict_keys(['__header__', '__version__', '__globals__', 'AB', 'wh'])
Shape of 'AB': (3301, 117)
Shape of 'wh': (1, 2)**
wavenumber_path = ‘’
**dict_keys(['__header__', '__version__', '__globals__', 'wavenumber'])
Shape of 'wavenumber': (1, 3301)**
refnames_path = ‘’
**dict_keys(['__header__', '__version__', '__globals__', 'refnames'])
Shape of 'refnames': (117,)**
input_path = ‘’
dict_keys(['__header__', '__version__', '__globals__', 'ab', 'wn'])
Shape of 'ab': (467, 65537)
Shape of 'wn': (1, 467)
import scipy.io as sio
import pandas as pd
import itertools
from sklearn.linear_model import LinearRegression
from scipy.interpolate import interp1d
import numpy as np

def create_data_frame(spectra_file, refnames_file, wavenumber_file):
    spectra_mat = sio.loadmat(spectra_file)
    data = spectra_mat['AB'].T
    data = data[:, ::-1]
    wavenumber_mat = sio.loadmat(wavenumber_file)
    wavenumber = wavenumber_mat['wavenumber'][0]
    wavenumber = wavenumber[::-1]
    refnames_mat = sio.loadmat(refnames_file)
    names = refnames_mat['refnames'].flatten()
    wav = wavenumber.tolist()
    names = np.char.array(names).tolist()
    final_data_frame = pd.DataFrame(data, columns=wav)
    final_data_frame['ID'] = names  # File ID or Reference names
    return final_data_frame

final_data_frame = create_data_frame(spectra_path, refnames_path, wavenumber_path)
print(final_data_frame.shape)
final_data_frame

ref_spectra_df = create_data_frame(spectra_path, refnames_path, wavenumber_path)
wavenumber_columns = [col for col in ref_spectra_df.columns if col != 'ID' and 900 <= float(col) <= 1800]
ref_spectra = ref_spectra_df[wavenumber_columns]
print(ref_spectra.shape)

dat2 = sio.loadmat(refnames_path)
names = dat2['refnames'].flatten()
names = [str(name[0]) for name in names]
names = list(itertools.chain.from_iterable(names) if any(isinstance(i, list) for i in names) else names)
X = df_input

ref_wavenumbers = np.linspace(1800, 900, ref_spectra.shape[1])
input_wavenumbers = np.linspace(1800, 900, X.shape[1])

interpolator = interp1d(ref_wavenumbers, ref_spectra, axis=1, kind='linear')
ref_spectra_interpolated = interpolator(input_wavenumbers)

regression_model = LinearRegression(positive=True)
regression_model.fit(ref_spectra_interpolated.T, X.T)
coefs = regression_model.coef_
coefs_df = pd.DataFrame(coefs.T, index=X.index)
coefs_df.columns = names
coefs_df = coefs_df.reindex(coefs_df.mean().sort_values(ascending=False).index, axis=1)
norm = coefs_df.mean()
coefs_df = coefs_df / norm
coefs_df = coefs_df.dropna(axis=1, how='any')
coefs_df.to_csv('CLS fitting results - Serum.csv')
The above code ended up while extracting coefs.
X=df_input which is input dataframe. the size is (256,256,467) which i reorganized as (256*256,467) which makes it (65536,467), where 65536 corresponds to each pixel.
so i further modified the regression code to iterate over each pixel.
regression_model = LinearRegression(positive=True)
coefs = np.zeros((X.shape[0], ref_spectra_interpolated.shape[1]))
for i in range(X.shape[0]):
    if isinstance(X, pd.DataFrame):
        y = X.iloc[i, :].values
    else:
        y = X[i, :]
    regression_model.fit(ref_spectra_interpolated, y.reshape(-1, 1))
    coefs[i, :] = regression_model.coef_

ValueError                                Traceback (most recent call last)
<ipython-input-35-fdd8039b578c> in <cell line: 6>()
      9     else:
     10         y = X[i, :]
---> 11     regression_model.fit(ref_spectra_interpolated, y.reshape(-1, 1))
     12     coefs[i, :] = regression_model.coef_

3 frames
/usr/local/lib/python3.10/dist-packages/sklearn/utils/validation.py in check_consistent_length(*arrays)
    395     uniques = np.unique(lengths)
    396     if len(uniques) > 1:
--> 397         raise ValueError(
    398             "Found input variables with inconsistent numbers of samples: %r"
    399             % [int(l) for l in lengths]

ValueError: Found input variables with inconsistent numbers of samples: [117, 467]
Additional Information
Final DataFrame shape: (117, 3302)
4000 3999 3998 3997 3996 3995 3994 3993 \
0 0.0 0.000000 0.000000 0.000000 0.000000 0.000000 0.000000 0.010017
1 0.0 0.076237 0.075786 0.092208 0.083860 0.089052 0.084329 0.093639
2 0.0 0.006262 0.009665 0.011625 0.016771 0.020251 0.021349 0.016950
3 0.0 0.073635 0.108422 0.166655 0.219240 0.290049 0.360189 0.441440
4 0.0 0.293801 0.386299 0.399522 0.278570 0.125340 0.022092 0.000000
3992 3991 ... 708 707 706 705 704 \
0 0.006314 0.031430 ... 0.000000 0.000000 0.000000 0.000000 0.000000
1 0.101848 0.128834 ... 0.000000 0.000000 0.000000 0.000000 0.000000
2 0.010785 0.004299 ... 0.006163 0.004709 0.003217 0.001170 0.000319
3 0.519642 0.607271 ... 0.000000 0.000000 0.000000 0.000000 0.000000
4 0.001895 0.040333 ... 0.019329 0.022445 0.023159 0.017931 0.006998
703 702 701 700 ID
0 0.000000 0.000000 0.000000 0.0 ATP
1 0.000000 0.000000 0.000000 0.0 Acid-phosphatase
2 0.000000 0.000000 0.000185 0.0 Actin
3 0.000000 0.000000 0.000000 0.0 Adenine
4 0.003938 0.004616 0.022361 0.0 Ala-Phe
[5 rows x 3302 columns]
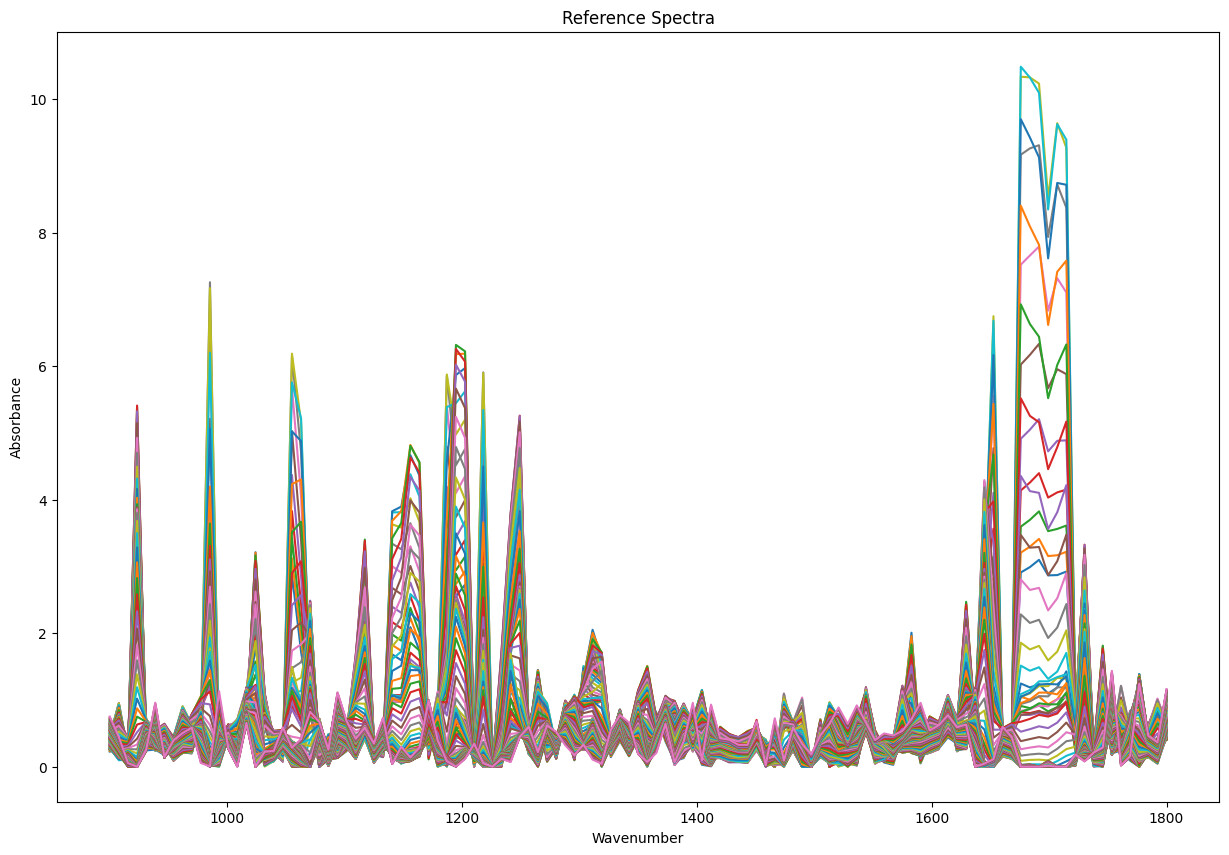
Reference Spectra shape: (117, 901)
1800 1799 1798 1797 1796 1795 1794 \
0 0.398656 0.400172 0.401489 0.404073 0.408325 0.414702 0.421624
1 0.690701 0.688172 0.684635 0.681072 0.677156 0.673283 0.669346
2 0.191147 0.197091 0.203515 0.210285 0.216416 0.223856 0.233328
3 0.000000 0.000000 0.000000 0.000000 0.000000 0.000000 0.000000
4 0.090553 0.101870 0.105062 0.107536 0.110965 0.119128 0.127208
1793 1792 1791 ... 909 908 907 906 \
0 0.429084 0.437233 0.447926 ... 0.003007 0.003197 0.003463 0.003506
1 0.666719 0.665631 0.666432 ... 0.002496 0.002457 0.002665 0.002789
2 0.245261 0.257144 0.268808 ... 0.000177 0.000900 0.002059 0.002893
3 0.000000 0.000000 0.000000 ... 0.055016 0.057460 0.060365 0.061447
4 0.139671 0.156604 0.181457 ... 0.000000 0.000000 0.000000 0.000000
905 904 903 902 901 900
0 0.003749 0.004070 0.004753 0.005364 0.006069 0.006608
1 0.003047 0.003060 0.003115 0.002932 0.002834 0.002494
2 0.003389 0.003392 0.003278 0.002821 0.002229 0.001372
3 0.060328 0.056912 0.053430 0.050287 0.048376 0.046766
4 0.000000 0.000000 0.000000 0.000000 0.000000 0.000000
[5 rows x 901 columns]
Names length: 117
First few names: ['A', 'A', 'A', 'A', 'A']
Interpolated Reference Spectra shape: (117, 467)
Coefficients shape: (65537, 117)
plt.plot(input_wavenumbers, ref_spectra_interpolated[:, i], label=name)
Any suggestions or anyone handled similar data, appreciate your time and help.