Dear all,
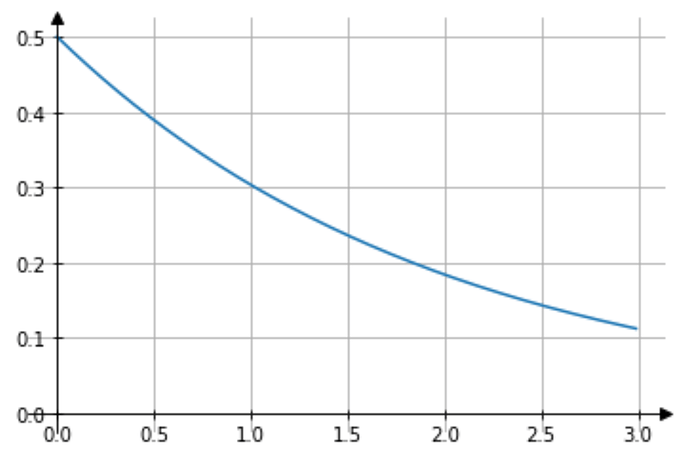
I try to set up a style for formatting my plots such that they always have their origin in (0,0), they have only axes for positive values and that they have an arrow at the head. I would like to do so for various kind of functions with different intervals for x and y
. By now I have solved some issues on that way resulting in this (see below). Unfortunately on the x-axes and y-axes the grid seems to be overhanging which I can’t get solved
a) What is the reason for it and how can I fix this?
b) On the x-axes the axes is longer than the function. I tried to fix this be replacing the last ticks on x-axes and y-axes and try to locate the arrow at that place. Unfortunately, if at that point the function has an intersection with the axes this does not work. Has anybody an idea how to approach this issue?
Thanks for any helpful comments
from scipy.stats import expon

x = np.arange(x_min,x_max,0.01)
y = expon.pdf(x,x_min,x_var)

rc = {"xtick.direction" : "inout", "ytick.direction" : "inout",
      "xtick.major.size" : 5, "ytick.major.size" : 5}
with plt.rc_context(rc):
    fig, ax = plt.subplots()

    ax.spines['left'].set_position(('zero'))
    ax.spines['bottom'].set_position(('zero'))
    ax.spines['right'].set_visible(False)
    ax.spines['top'].set_visible(False)

    # make arrows
    ax.plot((1), (0), marker=">", ms=6, color="k",
            transform=ax.get_yaxis_transform(), clip_on=False)
    ax.plot((0), (1), marker="^", ms=6, color="k",
            transform=ax.get_xaxis_transform(), clip_on=False)
    ax.plot(x,y)

    # Grids
    plt.grid(visible=True,clip_on=True)

    plt.show()
