Hi,
I am trying to assign two different color palettes based on gender to the plot below:
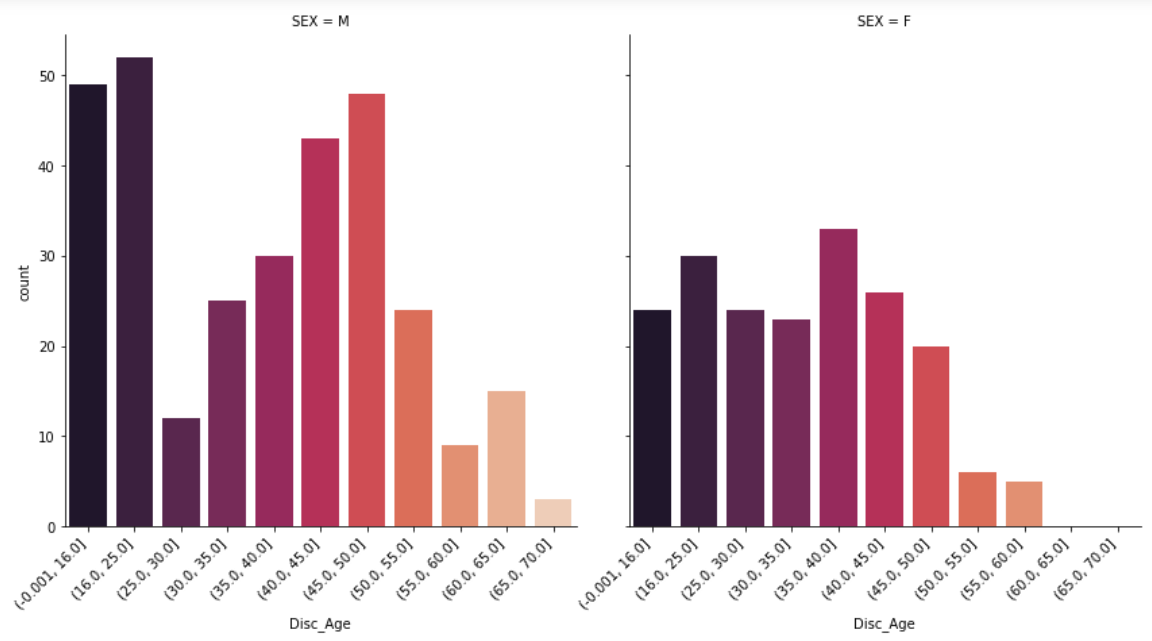
This is my code:
g = sns.catplot(data = run_data,
                x = 'Disc_Age',
                kind = 'count',
                col = 'SEX',
                aspect = 2);

h = sns.catplot(data = run_data,
                x = 'Disc_Age',
                kind = 'count',
                col = 'SEX',
                height = 6,
                palette = sns.color_palette('rocket', 11));

h.set_xticklabels(rotation=45, horizontalalignment='right')
Can you please help me? Thanks!