Hi,
I am trying to define existing worksheet but I am not able to do it.
I have copied code from below URL for reference.
Instead of adding a new worksheet I want to use existing worksheet from the workbook.
How do I edit worksheet = workbook.add_worksheet() this line.
I am trying to provide Sheet1 here but not able to do it.
Can anyone please help me this.
# import xlsxwriter module
import xlsxwriter
# Workbook() takes one, non-optional, argument
# which is the filename that we want to create.
workbook = xlsxwriter.Workbook( 'chart_bar.xlsx' )
# The workbook object is then used to add new
# worksheet via the add_worksheet() method.
worksheet = workbook.add_worksheet()
# Create a new Format object to formats cells
# in worksheets using add_format() method .
# here we create bold format object .
bold = workbook.add_format({ 'bold' : 1 })
# create a data list .
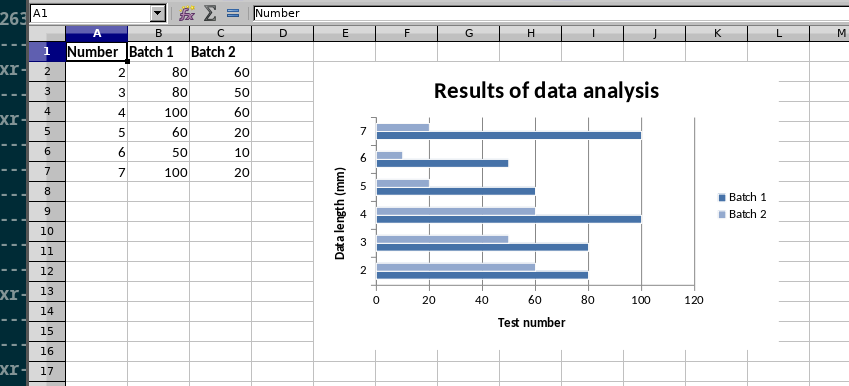
headings = [ 'Number' , 'Batch 1' , 'Batch 2' ]
data = [
[ 2 , 3 , 4 , 5 , 6 , 7 ],
[ 80 , 80 , 100 , 60 , 50 , 100 ],
[ 60 , 50 , 60 , 20 , 10 , 20 ],
]
# Write a row of data starting from 'A1'
# with bold format .
worksheet.write_row( 'A1' , headings, bold)
# Write a column of data starting from
# 'A2', 'B2', 'C2' respectively .
worksheet.write_column( 'A2' , data[ 0 ])
worksheet.write_column( 'B2' , data[ 1 ])
worksheet.write_column( 'C2' , data[ 2 ])
# Create a chart object that can be added
# to a worksheet using add_chart() method.
# here we create a bar chart object .
chart1 = workbook.add_chart({ 'type' : 'bar' })
# Add a data series to a chart
# using add_series method.
# Configure the first series.
# = Sheet1 !$A$1 is equivalent to ['Sheet1', 0, 0].
chart1.add_series({
'name' : '= Sheet1 !$B$1' ,
'categories' : '= Sheet1 !$A$2:$A$7' ,
'values' : '= Sheet1 !$B$2:$B$7' ,
})
# Configure a second series.
# Note use of alternative syntax to define ranges.
# [sheetname, first_row, first_col, last_row, last_col].
chart1.add_series({
'name' : [ 'Sheet1' , 0 , 2 ],
'categories' : [ 'Sheet1' , 1 , 0 , 6 , 0 ],
'values' : [ 'Sheet1' , 1 , 2 , 6 , 2 ],
})
# Add a chart title
chart1.set_title ({ 'name' : 'Results of data analysis' })
# Add x-axis label
chart1.set_x_axis({ 'name' : 'Test number' })
# Add y-axis label
chart1.set_y_axis({ 'name' : 'Data length (mm)' })
# Set an Excel chart style.
chart1.set_style( 11 )
# add chart to the worksheet
# the top-left corner of a chart
# is anchored to cell E2 .
worksheet.insert_chart( 'E2' , chart1)
# Finally, close the Excel file
# via the close() method.
workbook.close()