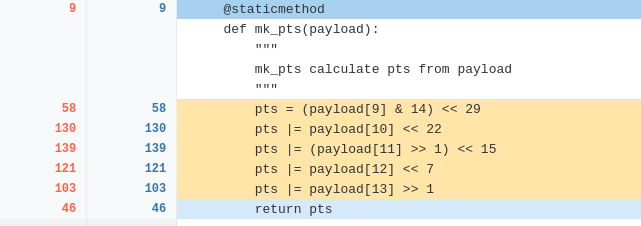
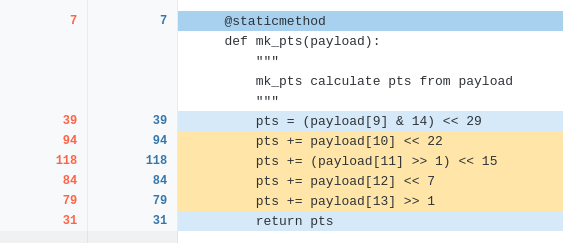
I was tuning up some code and Neil Schemenauer sent me a link to for a 3.14 with Tachyon and I am a HUGE fan.
For years, I avoided profiling, I thought it was only for fanatics and crazy people, but about seven years ago I tried profiling out of pure desperation and I’ve been hooked ever since.
If you don’t use a proiler, you have no idea what is really going on in your code. Tachyon is lightning fast too, no long wait times.
Tachyon has a line by line heat map, it highlights the problems for you.
I realize that it’s not a huge difference, and that is my point. Tachyon gives you really specific details in an easy to understand way. It’s a heat map, red is bad, yellow is kind of bad, blue is just a little bad.
I do, yes. You’re trying to write C code in Python. That’s usually not going to be the best way to do things.
I have no idea what a “pts” is or what the payload format is, but it may be worth considering a different way of reformatting this. There may be a better way to do it in Python, but given that you’re doing a little bit of bitbashing, there’s a good chance you’re actually doing a lot of bitbashing, which would make it worth whipping up a little Cython module.
And if you’re really concerned about performance, maybe don’t make static methods. Just have top-level functions. This doesn’t use any external state or even constants, so it’s a self-contained helper function (the very best of functions, in fact - it’s a pure translation function). Make a module with top-level functions and see if that helps your performance.
import timeit
from random import randbytes

payloads = [randbytes(14) for _ in range(10**5)]

def original():
    for payload in payloads:
        pts = (payload[9] & 14) << 29
        pts |= payload[10] << 22
        pts |= (payload[11] >> 1) << 15
        pts |= payload[12] << 7
        pts |= payload[13] >> 1
        pts

def improved():
    for payload in payloads:
        a = (payload[9] & 14) << 29
        b = payload [10] << 22
        c = (payload[11] >> 1) << 15
        d = payload [12] << 7
        e = payload [13] >> 1
        pts = a + b + c + d + e
        pts

def stefan(
    t9 = [(b & 14) << 29 for b in range(256)],
    t10 = [b << 22 for b in range(256)],
    t11 = [(b >> 1) << 15 for b in range(256)],
    t12 = [b << 7 for b in range(256)],
    t13 = [b >> 1 for b in range(256)],
):
    for payload in payloads:
        (
            t13[payload[13]] +
            t12[payload[12]] +
            t11[payload[11]] +
            t10[payload[10]] +
            t9[payload[9]]
        )

for f in [original, improved, stefan] * 3:
    t = min(timeit.repeat(f, number=1)) / len(payloads) * 1e9
    print(round(t), f.__name__)