Hi !
I am trying to make 5 graphs with lists of datas. I want to draw the graphs in log-log scale with pyplot.
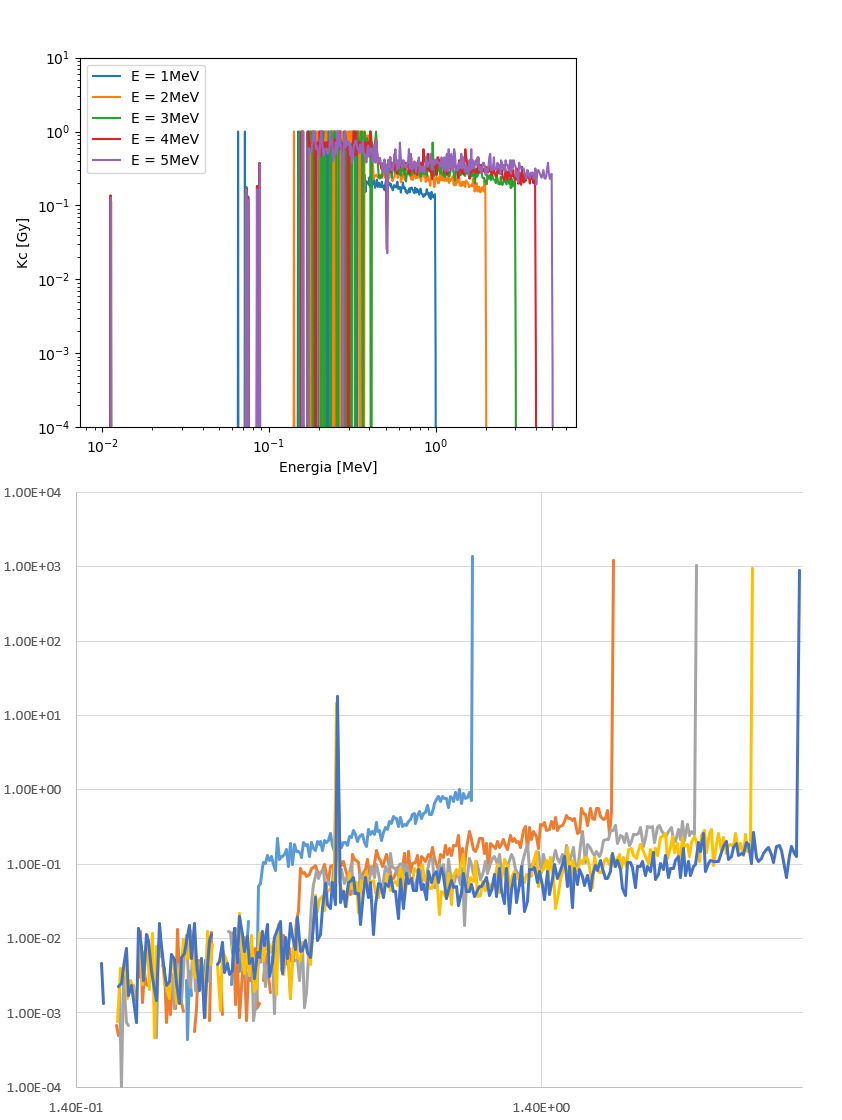
My issue is that the graphs are totally inverted (the increasing parts are decreasing in inversely). I drew theses with Excel to verify that. I have already verified that the datas in my lists are good, this is not the issue. Here are my code and the graphs, if you can find the reason it would be great.
Thanks in advance !
def graph(data) :
for i in range(len(data)) :
X =
Y =
for j in range(len(data[i])) :
x = (data[i][j][0] + data[i][j][1])/2
X.append(x)
if data[i][j][3] != 0 :
y = data[i][j][3]
else :
y = 1e-10
Y.append(y)
plt.plot(X, Y, label = 'E = '+ str(i+1) + ‘MeV’)
plt.xscale(‘log’)
plt.yscale(‘log’)
plt.show()
graph(lecture_fichier(“test.txt”))
The function “lecture_fichier” create the datas list. I already tried to change the limits but it doesn’t change anything.