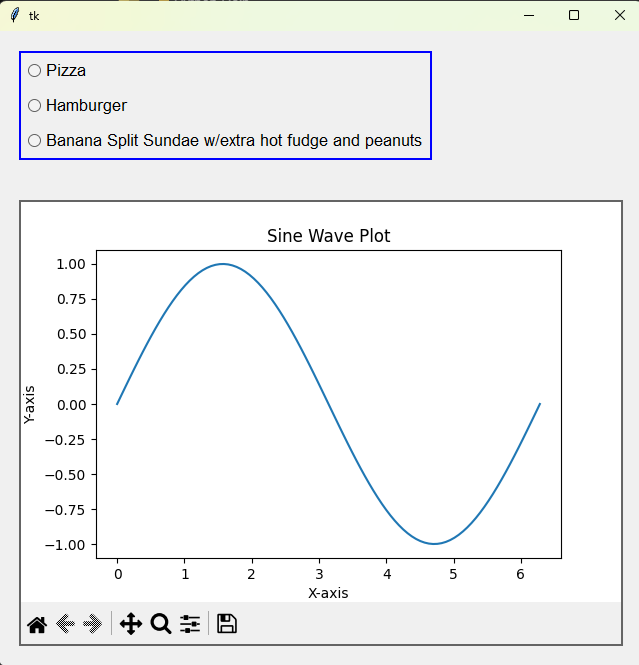
This works to place a Plot with a button below, as written. However…
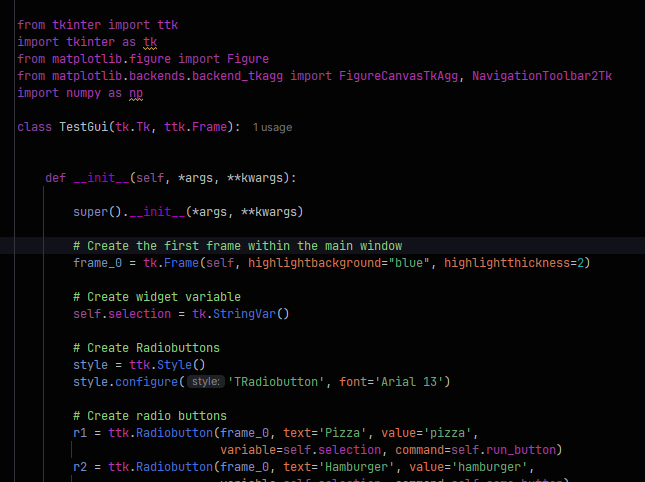
# 1. Importing Necessary Libraries:
import tkinter as tk
from matplotlib.figure import Figure
from matplotlib.backends.backend_tkagg import FigureCanvasTkAgg, NavigationToolbar2Tk
import numpy as np

# 2. Creating the Tkinter Window and Plot Function:
def plot_data():
    # Create a Matplotlib Figure
    fig = Figure(figsize=(6, 4), dpi=100)
    ax = fig.add_subplot(111)

    # Generate some data to plot
    x = np.linspace(0, 2 * np.pi, 100)
    y = np.sin(x)

    # Plot the data
    ax.plot(x, y)
    ax.set_title("Sine Wave Plot")
    ax.set_xlabel("X-axis")
    ax.set_ylabel("Y-axis")

    # Embed the Matplotlib plot into the Tkinter window
    canvas = FigureCanvasTkAgg(fig, master=root)
    canvas.draw()
    canvas.get_tk_widget().pack(side=tk.TOP, fill=tk.BOTH, expand=1)

    # Add Matplotlib's navigation toolbar
    toolbar = NavigationToolbar2Tk(canvas, root)
    toolbar.update()
    canvas.get_tk_widget().pack(side=tk.TOP, fill=tk.BOTH, expand=1)

# Create the main Tkinter window
root = tk.Tk()
root.title("Plot and Button Example")
root.geometry("800x600")

plot_data()

# 3. Adding a Button to Trigger the Plot:
# Create a button to trigger the plot
plot_button = tk.Button(master=root, text="Do Something")
plot_button.pack(pady=10)

# Start the Tkinter event loop
root.mainloop()
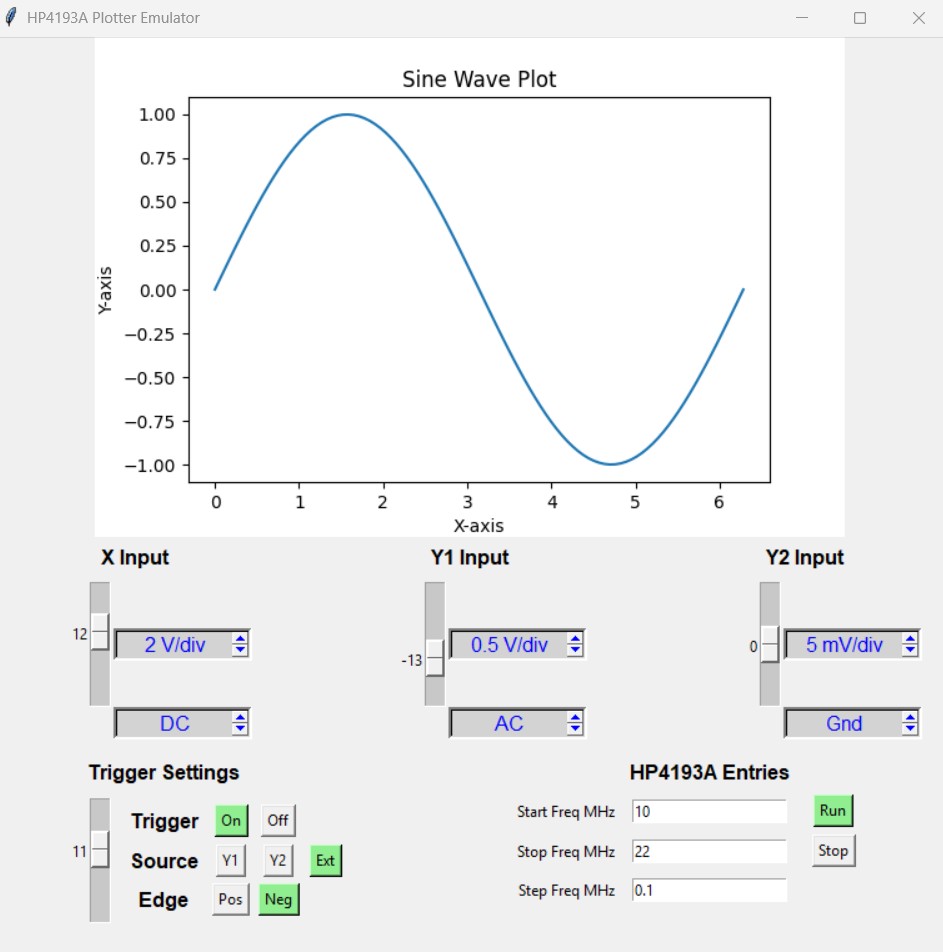
However I used Grid to place multiple widgets in my program.
I get the following error if I use Grid instead of pack in the above.

Apparently backend tk.py, in line 675, calls pack (I think). Pack and Grid are not compatible.
Place is compatible with Pack so I could try Place Relative to replace Grid.
I am using “Modern Tkinter for Busy Python Developers” by Mark Roseman. It has a chapter on Grid Geometry Manager but barely mentions Pack and Place.
Am I correct in my assessment?
There is a thread “Button Placement Using ‘grid’ via tkinter” that has a similar problem and the solution was not to use Grid.