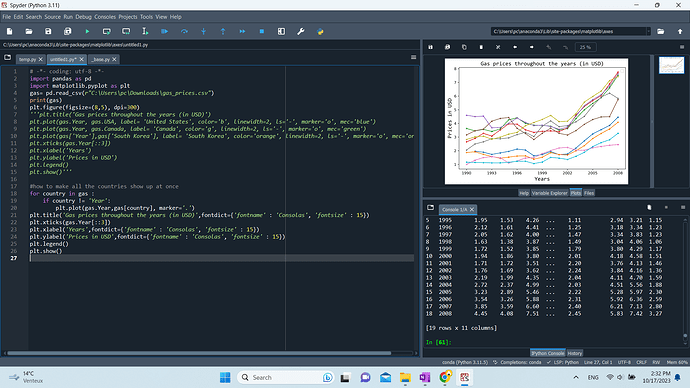
Hello, I’m a biology PhD student learning Python. I just started using matplotlib to make figures, and I can’t seem to figure out why legends don’t show up.
Here’s the script. Can anyone point out why?
PS: I’m also open to IDE suggestions. Somehow VS code isn’t working properly on my laptop and I’m not sure how good Spyder is. Thank you!
You have to provide arguments to the plt.legend() call. Add your labels and colors to a list as the for loop runs, then pass that to legend() as the handles. Something like:
import matplotlib.patches as mpatches
patches = []
for country in gas:
    (...)
    patches.append(mpatches.Patch(color=<color>, label=country)) # assign the color to each line

plt.legend(handles=patches, loc='upper right')
https://matplotlib.org/stable/api/_as_gen/matplotlib.pyplot.legend.html
