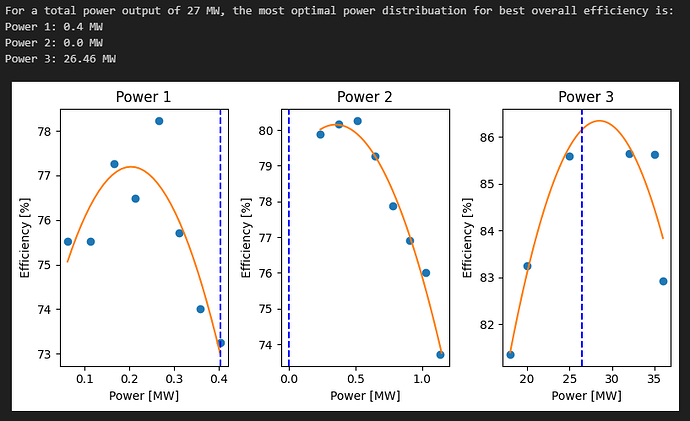
Hi! I have a problem with my python code not doing what I want it to do. The background is that I have made some efficiency curves for a given series of power output from three different production fields. In the code I have tried to use the “minimize” function to calculate the maximum overall efficiency possible for an overall power output based on power variables. The problem is that in addition to the polynomial function of efficiency I also want to add that for zero power production the efficiency is 100% because of zero energy losses. Therefore, if the best overall efficiency is given for only using one of the production fields, I want the code to set the remaining production fields to zero production. This does not work in my code. Appreciate all help ![]()
import numpy as np
from scipy.optimize import minimize
import matplotlib.pyplot as plt
import matplotlib.gridspec as gridspec

# Defining arrays of the power output and the corresponding efficiency

P1 = np.array([0.063, 0.113, 0.166, 0.214, 0.267, 0.312, 0.358, 0.403])
eta1 = np.array([75.532, 75.532, 77.269, 76.488, 78.227, 75.708, 74.006, 73.243])

P2 = np.array([0.237, 0.376, 0.515, 0.648, 0.777, 0.905, 1.029, 1.138])
eta2 = np.array([79.894, 80.166, 80.257, 79.267, 77.872, 76.901, 76.021, 73.721])

P3 = np.array([18.00, 20.00, 25.00, 32.00, 35.00, 36.00])
eta3 = np.array([81.360, 83.253, 85.589, 85.642, 85.624, 82.931])

P_tot = [P1, P2, P3]
eta_tot = [eta1, eta2, eta3]
tot_names = ['Power 1', 'Power 2', 'Power 3']

# Making polynomial functions of the defined arrays

coefficient = [np.polyfit(P, eta, 2) for P, eta in zip(P_tot, eta_tot)]
polynomal = [np.poly1d(c) for c in coefficient]

P_poly = [np.arange(P[0], P[-1]+0.01, 0.01) for P in P_tot]
eta_poly= [polynomal(P) for P, polynomal in zip(P_poly, polynomal)]

total_power = 27

# Defining 'neg_function', which is inversely proportional to the sum of all the efficiencies. The goal is to maximize total efficiency by minimizing the negative product of the effiociency
def neg_function(x):
    efficiencies = [100 if xi == 0 else poly(xi) for xi, poly, P in zip(x, polynomal, P_tot)]
    return -(efficiencies[0]*efficiencies[1]*efficiencies[2])

# Defining the constraints: produced power should be equal to total power.
constraints = [{'type': 'eq', 'fun': lambda x: x[0] + x[1] + x[2] - total_power}]

x0 = np.array([0.5, 0.5, 0.5])

# Using the minimize function to calculate the minimum value of the neg_function.
solution = minimize(neg_function, x0, constraints=constraints, bounds=[(0, max(P_tot[0])), (0, max(P_tot[1])), (0, max(P_tot[2]))])

print(f'For a total power output of {total_power} MW, the most optimal power distribuation for best overall efficiency is: ')
for i in range(len(tot_names)):
    print(f"{tot_names[i]}: {round(solution.x[i], 2)} MW")

# Plotting the efficiency curves and the optimal power output

figure, axis = plt.subplots(nrows=1, ncols=3, figsize=(8, 4))
data1 = [
    (P1, eta1, P_poly[0], eta_poly[0], tot_names[0]),
    (P2, eta2, P_poly[1], eta_poly[1], tot_names[1]),
    (P3, eta3, P_poly[2], eta_poly[2], tot_names[2])
]

for axis, (x, y, x_poly, y_poly, title) in zip(axis.flatten(), data1):
    axis.plot(x, y,  'o', x_poly, y_poly, '-')
    axis.set_title(title)
    axis.set_xlabel('Power [MW]')
    axis.set_ylabel('Efficiency [%]')
    index = tot_names.index(title)
    axis.axvline(x=solution.x[index], color='b', linestyle='--')  # adding a blue vertical line by the optimal power output
plt.tight_layout()
The following picture shows the code output. For a total power output of 27 MW the most optimal power distribuation should be producing all power form “Power 3”
