As in Python download stats for March 2019, I recently did some analysis of the python.org download logs. I used better tooling this time, so I have some more interesting numbers, and I’m also happy to run more queries if people have ideas (though all I have access to is essentially the URL).
I filtered out a few obvious scrapers, but it made little difference. They showed up with a high absolute number of hits, but evenly distributed across every single file on the server. The badly behaved downloaders from last year seem to be gone.
Category
Downloads
Users
Downloads/user
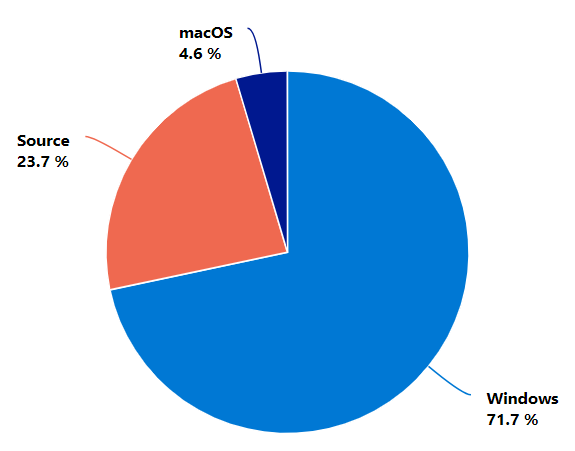
Windows
15,999,056
3,941,325
4.06
Source
5,297,204
832,034
6.37
macOS
1,022,698
309,514
3.3
Sig
770,146
58,952
13.06
Docs
430,758
63,257
6.81
Other
18,984
1208
15.72
RPM
16,076
573
28.06
Definitions:
Windows any of the .exe, .msi or .zip packages, not counting sub-parts of an install (so only the 2.7 MSIs, essentially)
macOS any .dmg or .pkg file
Source any of the archives, except those containing docs
Docs those containing docs
Sig any .gpg, .asc or .md5 files
RPM some old .rpm files that are still floating around
Other anything else
Operating Systems
As with last year, this is heavily biased towards Windows, as python.org is the primary source for most users. Though this year, the Microsoft Store is an alternative - according to my dashboard, there were 226,272 downloads in the same time period. So quite small (1.4%) compared to python.org.
Versions
This chart is all downloads relating to a particular version (based on the directory name).
Version
Downloads
Users
3.9
193,347
32,902
3.8
10,173,285
2,945,632
3.7
6,449,794
1,611,958
3.6
2,207,577
475,685
2.7
2,121,831
469,376
Hope this is informative or interesting to people. I’m happy to take questions or requests for other pivots.
Hi Steve,
I think the Windows bias will vanish by adding:
The 20M downloads that go via anaconda? I’m sure @teoliphant can provide the stats.
The 44M downloads that go via linux / apt? I’m not sure python.org ever sees these.
Others? All the server downloads go via Kubernetes / Docker / …?
Sure, that’s the point: we need other data. This isn’t at attempt to encompass all the data though - someone has to publish the raw measurements (along with the biases) so that the meta-analysis can be done.
Though last I heard, Anaconda is just as biased towards Windows, so that may not “balance” it that much. Data from the Linux distros would be very interesting though!
It is, in the user agent string at least. That’s a lot more data though, but if you pay for BigQuery then you can run the numbers against it.
Unfortunately, it’ll be much harder to separate “bot” installs (CI, deployments) from actual users, even if you have source IP addresses, so all its really going to tell you is “who has the biggest clusters and the least caching”
we don’t have this data; we don’t track what users install.
the package manager uses Python, so all installations of Fedora have Python installed (except some super-minimal container images). That’s 3.7 for Fedora 31, 3.8 for f32, 3.9 for f33.
would creating a VM or a container with Python count as installing Python, anyway? I install Python into a chroot(-ish environment) several times a day when I do packaging.
Yeah, this is a tough question, because it depends on what you’re trying to find out, as well as what the person is actually doing.
For most questions, the number of unique users who have installed any version(s) is a pretty good indicator of “how many people will notice %CHANGE%”. But unique machines doesn’t reflect users, since that’ll count one person installing the same thing on 1000 machines as 1000 instead of 1, while a single Docker install won’t reflect the 1000 users who end up using it. Maybe they average out? But how can we ever know?
It’s a tough area to try and openly share data, but I tried. (Note that I never asked or suggested that anyone else should release their data, only that if people want it then I’m not the one who can provide it.)
Is it possible to get these numbers for 2022? Are the download logs available for everyone?
I am creating a new python library and trying to figure out what minimum version of Python shall I target. These number will play a pivotal role in deciding things like, shall I use threading or shall I rely on asyncio etc.
The updated numbers are in another thread, I did it in March. Because the download logs include personally identifiable information, we don’t share them publicly.
Your library should probably support all active versions listed at Download Python | Python.org and also the next version (3.11, currently in beta). Depending on your target audience, they might need some older versions as well. There’s no need to support anything already end-of-life.