Here’s a working solution, @cyberblitz. Since you didn’t say what packages you’re using, if any, and also didn’t say what produces the raw data table in the OP, I only used builtin Python functions and took some liberties to structure the data in a simple form so I could focus on the stacking and concatenating that’s the core of your question.
Restructured Data: <ClickToView>
- Padded table with ‘
space’ characters to put data into columns (as posted above).
This was necessary because of the space in the dateTime columns, otherwise a simple <string>.split would have broken the contents of each row into separate data elements.
- Padded Header row to left-justify each column header at the beginning of the column.
This allows the header row to define the beginning of each data column.
RowText         AlloIndex  PosIndex    FromTime            ToTime                   OverLapIndex
test1           0          0           21/06/2022 14:42    22/06/2022 2:43          0
test2           0          0           21/06/2022 14:42    22/06/2022 2:43          1
test3           0          0           22/06/2022 2:42     22/06/2022 14:43         0
⋮
The core algorithm here just wants to receive a list[] of table rows whose members are a list[] of the values in each row–without the header row.
Preprocessed Data (Prepped for Surgery): <ClickToView>
['test1', '0', '0', '21/06/2022 14:42', '22/06/2022 2:43', '0']
['test2', '0', '0', '21/06/2022 14:42', '22/06/2022 2:43', '1']
['test3', '0', '0', '22/06/2022 2:42', '22/06/2022 14:43', '0']
⋮
The Process
- Read the data table into rows (from a file, in this case).
- Sort the table by ToTime within each AlloIndex group.
- Loop through the table rows.
- compare the current
end time with the next start time.
if: the next booking will fit on the same Gantt chart line, append it to the table as a concatenated item.else: increment the AlloIndex and append the row to the table as a "next line’ item (AlloIndex > 0).
- Convert the Unix time values back to date strings and put the headers back onto the top row.
import datetime
import time

with open('BookingData.csv', 'r') as fil:
    rawBookings = fil.readlines()

columnNames = rawBookings[0].split()
columns = [rawBookings[0].find(col) for col in columnNames]     #find where headers start
columns.append(len(rawBookings[1]))     #capture end of last column
bookingList = [row.rstrip() for row in rawBookings]     #remove '\n' from each row
bookingList.pop(0)  #get rid of headings

bookingRow = []
bookingTable = []
for row in bookingList:                                                 #loop through the rows
    for idx in range(len(columns)-1):                                   #loop through the columns
        bookingRow.append(row[columns[idx]:columns[idx+1]].rstrip())    #build a list with each column value in the row; remove extra spaces
    bookingTable.append(bookingRow)                                     #build a table of the row lists
    bookingRow = []

for row in bookingTable:
    print(row)

dateFormat = "%d/%m/%Y %H:%M"
for row in bookingTable:    #convert date+time strings to Unix Time (decimal seconds since 1 Jan 1970)
    row[3] = time.mktime(time.strptime(row[3],dateFormat))
    row[4] = time.mktime(time.strptime(row[4],dateFormat))

print("="*100)
print(columnNames)
for row in bookingTable:
    print(row)

currRow = []
alloGroup = []
currAlloIndex = '0'
groupSorted = False
for rowIdx,row in enumerate(bookingTable):          #sort AlloIndex groups by endTime
    if groupSorted and currAlloIndex == row[2]:     #AlloIndex group is sorted; don't sort again
        continue
    groupSorted = False
    currAlloIndex = row[2]
    groupIdx = rowIdx
    while groupIdx != len(bookingTable) and bookingTable[groupIdx][2] == currAlloIndex:  #look through remaining records for this AlloIndex
        alloGroup.append([bookingTable[groupIdx][4],bookingTable[groupIdx]])
        groupIdx += 1
    sortedGroup = sorted(alloGroup, key = lambda x: x[0])
    groupIdx = 0
    for offset,booking in enumerate(sortedGroup):
        bookingTable[rowIdx+offset][5] = 0
        bookingTable[rowIdx+offset] = booking[1]
    alloGroup,sortedGroup = [],[]
    groupSorted = True

Gantt = []
for rowIdx,row in enumerate(bookingTable):
    if not Gantt or row[1] != currAlloIndex:    #if first row of table or first item in AlloIndex group...
        Gantt.append(bookingTable[rowIdx])      #close out Gantt row; append a new row; process next alloIndex
        currAlloIndex = row[1]
        prevEndTime = row[4]
        prevOverlapIdx = 0
        continue
    if row[3] < prevEndTime:    #booking requires new line
        prevOverlapIdx += 1     #set overlapIndex
    else:    #close out Gantt row; reset OverlapIndex
        prevOverlapIdx = 0
    Gantt.append(bookingTable[rowIdx])          #Add row to data table
    bookingTable[rowIdx][5] = prevOverlapIdx    #apply appropriate overlapIndex to table row

for row in Gantt:   #convert Unix Time to date strings
    row[3] = datetime.datetime.fromtimestamp(row[3]).strftime('%d/%m/%Y %H:%M')
    row[4] = datetime.datetime.fromtimestamp(row[4]).strftime('%d/%m/%Y %H:%M')

Gantt.insert(0,rawBookings[0].rstrip())     #add the headers back in

print("="*100)
for row in Gantt:
    print(row)
[details="Output Data (manually columnized) ]
RowText     AlloIndex  PosIndex  FromTime             ToTime               OverLapIndex
['test1',   '0',       '0',      '21/06/2022 14:42',  '22/06/2022 02:43',  0]
['test2',   '0',       '0',      '21/06/2022 14:42',  '22/06/2022 02:43',  1]
['test3',   '0',       '0',      '22/06/2022 02:42',  '22/06/2022 14:43',  2]
['test4',   '0',       '0',      '22/06/2022 14:42',  '23/06/2022 02:43',  0]
['test5',   '5',       '5',      '21/06/2022 19:42',  '22/06/2022 07:43',  0]
['test6',   '6',       '6',      '21/06/2022 16:42',  '22/06/2022 04:43',  0]
['test7',   '7',       '7',      '21/06/2022 15:42',  '22/06/2022 03:43',  0]
['test8',   '7',       '7',      '21/06/2022 19:42',  '22/06/2022 07:43',  1]
['test9',   '8',       '8',      '21/06/2022 21:42',  '22/06/2022 09:43',  0]
['test10',  '8',       '8',      '21/06/2022 22:42',  '22/06/2022 10:43',  1]
['test12',  '9',       '9',      '21/06/2022 15:42',  '22/06/2022 03:43',  0]
['test11',  '9',       '9',      '22/06/2022 00:42',  '22/06/2022 12:43',  1]
['test14',  '9',       '9',      '22/06/2022 10:42',  '23/06/2022 10:43',  0]
['test13',  '9',       '9',      '22/06/2022 12:42',  '23/06/2022 12:43',  0]
['test15',  '10',      '10',     '21/06/2022 20:42',  '22/06/2022 08:43',  0]
['test16',  '10',      '10',     '22/06/2022 01:42',  '22/06/2022 13:43',  1]
[/details]
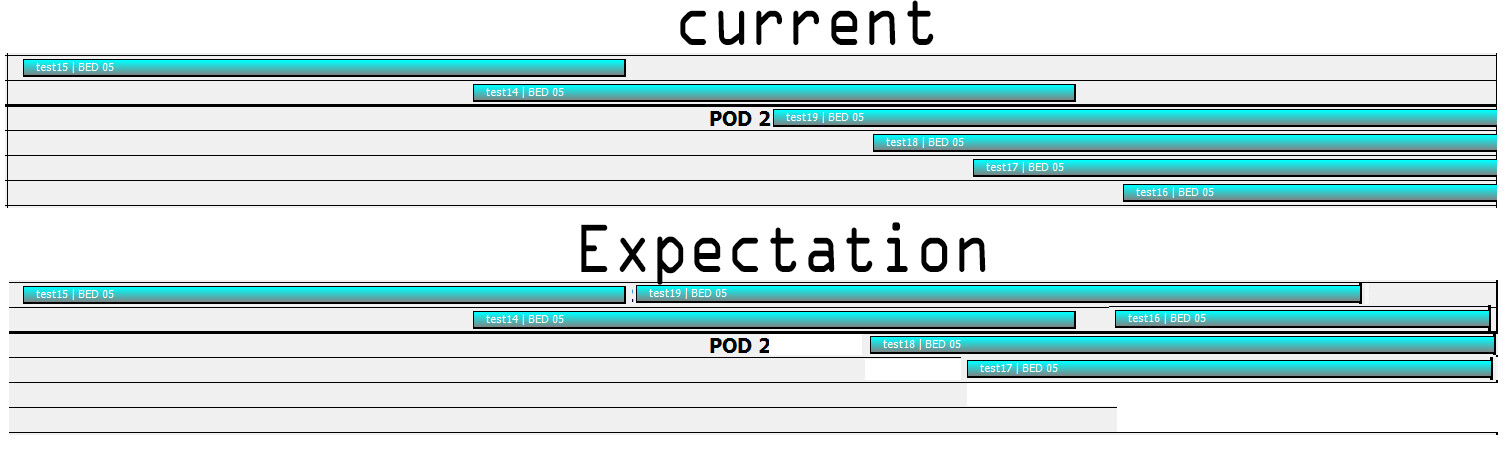
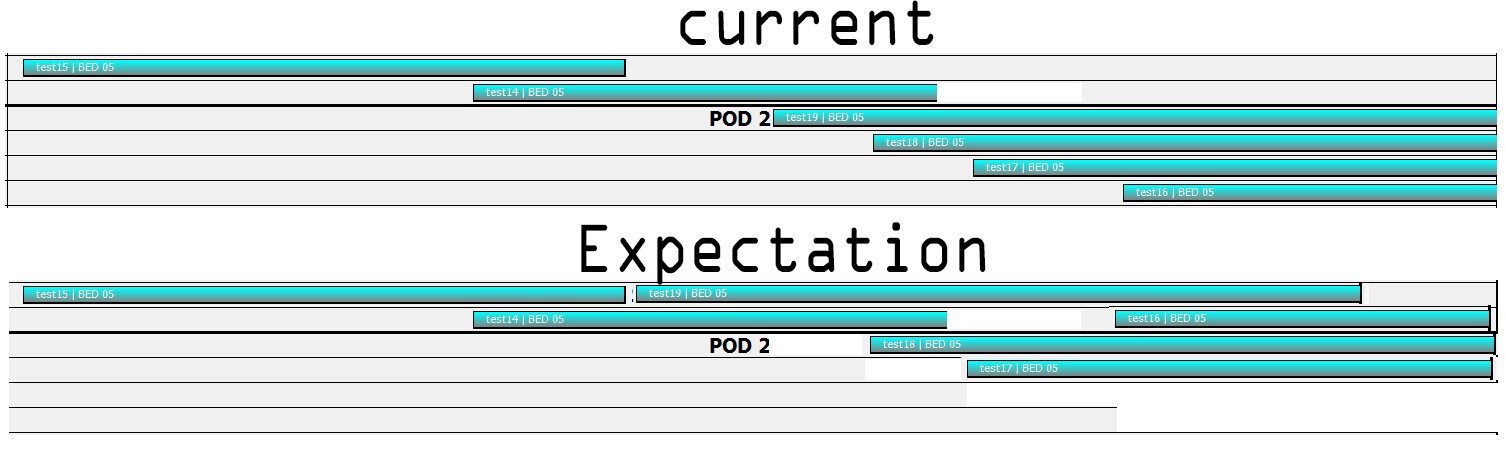
This is a relatively rudimentary algorithm and won’t optimize every case. For example, another search loop can be added to optimize the concatenation onto each Gantt row based on the duration of each booking.
I assume you have a function to render the Gantt chart…something that converts the bookings table into the Gantt bars. If so, please paste the end result! 
[EDIT: ] I forgot to paste the output data.