Use of groupby in a function for dataframe

Hello,

I’m totally stuck with a task on using groupby in a dataframe.

I have the following df in a csv file 'athletes.csv:

,forename,surname,gender,age,100m,200m,400m,800m,1500m
0,Migdalia,Parrish,F,18,11.08,29.0,59.41,122.05,259.11
1,Valerie,Lee,F,10,17.23,46.0,100.02,232.64,480.95
2,John,Debnam,M,17,10.81,25.89,50.6,110.29,232.39
3,Roy,Miller,M,10,19.18,46.74,95.32,201.14,430.27
4,Aida,Aumiller,F,11,15.3,41.83,81.06,189.03,394.9
5,Marcia,Brown,F,19,11.13,24.62,57.59,119.13,256.37
6,Harry,Knows,M,16,12.39,25.94,49.67,106.56,237.14
7,Barry,Lennon,M,14,11.15,23.56,46.46,110.89,230.49
8,Lilia,Armstrong,F,13,8.84,25.09,59.54,128.95,258.47
9,Johnny,Casey,M,15,9.65,22.67,49.46,112.85,233.87
10,Donald,Taylor,M,15,11.74,22.42,49.22,114.62,224.63
11,Martha,Woods,F,14,9.01,24.34,55.25,118.8,254.87
12,Diane,Lauria,F,15,8.99,27.92,54.79,119.89,249.21
13,Yvonne,Pumphrey,F,16,8.84,27.29,57.63,123.13,247.41
14,Betty,Stephenson,F,14,11.04,28.73,59.05,126.29,256.44
15,Lilia,Armstrong,F,12,11.31,34.43,74.28,150.05,321.07

The task is to call (and print) from a main function another function which takes three attributes:

  • The dataframe df
  • The age 15
  • The mean value for all events (100m,200m,400m,800m,1500m)) for the age 15
    The function should be grouped by gender and should reset the index.

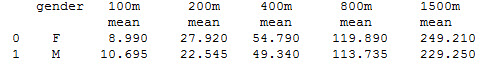
The output should be like the below.
Input:
age_statistics(df,15,‘mean’)
Output:
img

# function to groupby 
def age_statistics(df,age,mean):
# no idea how to build it  
    aggregated_dataframe = aggregated_dataframe.reset_index(drop=False)
    return aggregated_dataframe

# main function
def main(filename='athletes.csv'):
    df = pd.read_csv(filename, index_col=0)
    df['100m'] = df['100m'].astype(float)
    df['200m'] = df['200m'].astype(float)
    df['400m'] = df['400m'].astype(float)
    df['800m'] = df['800m'].astype(float)
    df['1500m'] = df['1500m'].astype(float)
    print(age_statistics(df,15,'mean'))

# Do not edit this
if __name__ == "__main__":
  main()
  

Anybody can help with that?

Hi @Giorgina99 , funny enough I actually almost showed you a bit about how to use groupby on your previous question, but ended up taking a shortcut instead and using sort_values since you’d already used it in your code there.

First off as a sidenote, like I mentioned over there, you actually don’t need to manually convert all the distance columns to floats, as pandas converts them automatically when you read in your CSV. You can check this by running df.info() on your DataFrame df, which will show you the data types of each column.

With that out of the way, let’s break down your problem. The key aspect here is understanding how the pandas groupby method works, which should solve the heart of the problem in one fell swoop. It can take a little time to wrap your head around, but once you have a basic grasp of it, groupby can be an incredibly powerful tool useful in solving a wide variety of problems with relatively little effort.

I highly recommend reading the Pandas Split-Apply-Combine user guide, which focuses on exactly this sort of problem you’re given. Specifically, I suggest reading at least the introduction and the top-level parts of the Splitting an object into groups and Aggregation sections (feel free to skip the subsections for now).

The key strategy to solving programming problems is breaking them down into small enough chunks that you can accomplish each one with a single existing function/method. Once you are experienced enough in doing this, there’s very little limit to what you can accomplish! (that, and learning how to read documentation and search Stack Overflow :smiley: )

Here’s how you might break this one down:

  1. First, you know you want just the runners of a certain age. IIn other words, you want to select all rows that have a certain value for one of the columns, (Hint: If you recall back to your previous problem, you already know how to do this!)
  2. Also, you can see you don’t need some of the columns in your output. Therefore, you want to drop them from your processed dataframe. (Hint: Pandas has an appropriately named function that will do just this)
  3. Next, you need to group the selected data by the gender (Hint: You can use the groupby method as suggested above)
  4. Then, you need to get the mean of each gender; in other words, aggregate your data via a specific function, in this case one that gets the mean (Hint: You can call aggregation methods, like mean(), sum(), max(), min(), etc on the groupby objects, to get the mean, sum, max, etc. for each group and column)
  5. Finally, you can see in the output that specific column names for the mean columns are desired. You could manually replace each of then, like you did last time, but it would be simpler, easier and more reliable to just append mean to every column name. (Hint: Pandas has a method to add a suffix to each column name, named exactly that)

Hopefully that helps guide you in what you need to do! If you still have questions or run into issues after carefully reading this and the documentaion, or would like feedback on your code, please do let us know. Cheers!

which takes three attributes:

On a minor note, sorry if I’m being a little pedantic :smiley: but to avoid confusion, functions have parameters (e.g. df, age, mean) which take arguments (e.g. df, 15, 'mean'); attributes are properties (in the colloquial sense; a property has a specific meaning in Python but we won’t worry about that now!) of a class instance that you access using .. For example, index in df.index is an attribute of the DataFrame df. Does that make sense?

1 Like

Hi @CAM-Gerlach, many thanks again for the detailed explanation.
Yes, I forgot to remove the floats,now it’s done.
I’ll go through your steps, that’s the direction I needed!!
Cheers!!

1 Like

I did the coding below, where I generated two groups, one with the females of 15 years’old and one with the males of 15 years’old: females15 and males15 (practically I did the points 1 and 3 of your list, while I didn’t do the point 2 because I thought that I needed all the times in order to calculate the mean values). After that I tried to group females15 and males15 based on the mean values of the distances, but didn’t work. Where am I wrong now?

# Task 2 function to group
def age_statistics(df,age,mean):
  females15={}
  females15 = df.loc[(df.gender == 'F') & (df['age'] == age)]
  males15={}
  males15 = df.loc[(df.gender == 'M') & (df['age'] == age)]
  aggregated_dataframe = df.groupby([females15],[males15]]).agg(
      {
         mean:{attribute,'mean'}  
      }
      )
  aggregated_dataframe = aggregated_dataframe.reset_index(drop=False)
  return aggregated_dataframe

# Task 1 main function
def main(filename='athletes.csv'):
    df = pd.read_csv(filename, index_col=0)
    print(df.dtypes)
    print(age_statistics(df,15,'mean'))

Hi @Giorgina99 , as a general tip, explaining in detail what “didn’t work” (what full error/traceback did you get? what output did you see?) almost invariably makes it way faster, easier and more effective for us to give helpful advice, then trying to simply guess based on manually examining all the lines of your code. Usually, the error traceback or bad behavior contains valuable information that not only helps us pinpoint the problem and figure out how to fix it, but also provides us an opportunity to explain to you how to do the same, giving you the tools to better solve problems yourself in the future. Just something to keep in mind!

Taking a look at your code, your main() function looks just fine. The problems arise in your age_statistics function. First, you have an extra closing square bracket on the line defining aggregated_dataframe. Second, in your agg call, you have a variable attribute which isn’t defined anywhere, and I don’t believe that argument to agg is in the correct form. Third, you’re passing two arguments to groupby, and both wrapped in lists, instead of a single list, which sitll doesn’t do what you intend it to. Finally, besides all that, per point 2 you want to drop the dataframe columns that aren’t used in the output: surname, first name and age, not the times columns (sorry if it was confusing above), as otherwise pandas will try to take the mean of that non-numeric data and fail with an error.

There’s also some other issues. The lines females15={} and males15={} don’t do anything, they define empty dictionaries, but then you immediately overwrite them with a portion of your dataframe. Its also rather unusual (though not technically incorrect) that in the same line, you address one column by attribute (df.gender) and another by slicing (df['age']); its best to stick to one or the other (preferably the latter, since it works for all column names). While its clear you tried to use your mean function argument, its not clear from the problem statement provided what it is supposed to represent (the statistic to use? the suffix to add to the column names? Something else?), and in any case its not being used for any of that, so I’m just going to ignore it for now.

Overall, onstead of trying to fix those issues one by one (and I’m still not sure it would even work), I suggest taking a much simpler, faster and less error prone approach. Rather than manually trying to split by each gender value, you should use groupby to, well, group the data by the gender column—that’s its whole purpose. Then, instead of calling agg with a complicated arg, you can just call the mean() function, and boom, you’ve got your means. Before that, you’d want to filter by age and drop the unneeded columns, and after it, you’d add the mean suffix to your column names and reset your index.

Overall, it should be about three lines of code, and hopefully you can figure out what you need to do from the above. However, if you’re still stuck after trying to do the above, or want to check your work, I’ve included more specific detail about what should be in each of those three lines in the details dropdown below.

  1. In the first line, you can subset your input dataframe df just the desired age (just as you do now), and then use .drop to drop the first and last name columns, and age (which is no longer needed)
  2. In the second line, you can call .groupby() on the filtered dataframe from step 1, with the name of the column you want to group by as its argument ("gender"), and then on that, call .mean() instead of .agg().
  3. In the third line, you can call the .add_suffix() method on the result of line two to add a " mean" suffix to each column name, and call reset_index() on that (as you do) to reset the indicies

Cheers!

1 Like

Many Thanks @CAM-Gerlach for the clarifications, really appreciated!! Now I think I understood and the coding works!!

# Task 2
def age_statistics(df,age,mean):
  aggregated_dataframe1 = df.loc[(df['age'] == age)].drop(columns=['forename','surname','age'])
  aggregated_dataframe2 = aggregated_dataframe1.groupby(['gender']).mean()
  aggregated_dataframe = aggregated_dataframe2.add_suffix(' mean').reset_index(drop=False)
  return aggregated_dataframe

# Task 1 main function
def main(filename='athletes.csv'):
    df = pd.read_csv(filename, index_col=0)
    print(df.dtypes)
    print(age_statistics(df,15,'mean'))

Thanks again for your patient explanations, i could understand each step clearly!!

1 Like

I have a last quick one: if I want to add the suffix ‘mean’ in the row below and not in the same row, how can I do? I went through all internet and didn’t find any command, tried with ‘\n’, but didn’t work!!

Looks pretty good! Other than please trying to be consistent with your indent levels (TL;DR: Always use for spaces; just set TAB in your Editor/IDE to this and then you never have to worry about it again), my only major comment would be that you’re passing the argument 'mean' as a string to the parameter mean of your function, but don’t actually use it.

Reading your problem statement more carefully, what is this mean parameter supposed to do? Is it just the suffix to append to the column names? If so, just replace the string literal 'mean' with mean to use it. Or is it (as I think it might be) also the statistic that is being requested (i.e. the caller of your function could also pass sum, median, count, max, etc, which is what the _statistics in the function name leads me to believe? If so, you can also replace the literal mean() call with using getattr(aggdf1.groupby(['gender'], statistic)() (renaming the param to statistic as that makes more sense), which uses Python’s getattr function to get the attribute of the groupby object that matches the string provided, and then calls it with (). Or is it supposed to be something else?

Hmm, well this turned out to be not so quick :joy: It really has more to do with the finer points of the presentation of the result in your output format than anything with the structure of the DataFrame itself. However, after spending far too much time searching myself, I couldn’t find a clean way to do it using pd.set_option, pd.style (which looks like it would have worked, but only in Jupyter notebooks) or various hacks.

However, there is a way to do this, but it requires changing the structure of your DataFrame, using a fairly common but more advanced feature of pandas: MultiIndexes (I recommend reading through at least the first subsection). Basically you’re adding another level to your columns, which can make sense if you want to add multiple metrics to your df, (e.g. mean, max, min, median, etc) but does make working with your df a bit more complex until you’re familiar with multiindexing concepts (see previous guide).

To do this, after your groupby line, you can use pd.MultiIndex.from_tuples to build your new column indices from the old ones with an extra level, and for your tuples, you have [(colname, 'mean') for colname in aggregated_dataframe2], which uses a list comprehension to build a list of tuples of each current column name and ‘mean’, which then get set to two different levels of column names if you assign the result to aggregated_dataframe2.columns. You’d then use reset index after that to add gender as a column, as you did before (so it doesn’t get the mean treatment).

So, you’d remove the last line with the add_suffix call and add a line before that like this (I shortened your df names for brevity):

    aggdf2.columns = pd.MultiIndex.from_tuples(
        [(col, "mean") for col in aggdf2.columns])

Then, just return aggdf2.reset_index(drop=False) and you get the result with two column levels.

Again, though, keep in mind this significantly changes the structure of your returned dataframe just for some aesthetics (unless you plan to add more statistics, in which case it makes perfect sense), so make sure that you and any other callers are prepared to handle that.

1 Like

Wow, I didn’t expect that adding one line would have been so complex.
The output with the use of MultiIndex looks very nice and works greatly!!

Many thanks again for the insights, they are crystal clear and help me a lot to understand how the coding works!!

1 Like

Neither did I, haha; I thought from the start I might have to take the MultiIndex approach, but even then that took a fair amount more fiddling than expected. Most of it was just in explaining a bit about MultiIndicies, since they are a fair bit more complex than regular pandas indexing.

Glad to hear! My goal here is not only to help others solve a particular problem, but also to guide them in understand the problem space as a whole, and share high-level strategies to help tackle a whole domain of problems, and it sounds like I’ve helped at least a little in that regard. Plus, I always learn something too, of course!

Cheers!

1 Like