Hello!
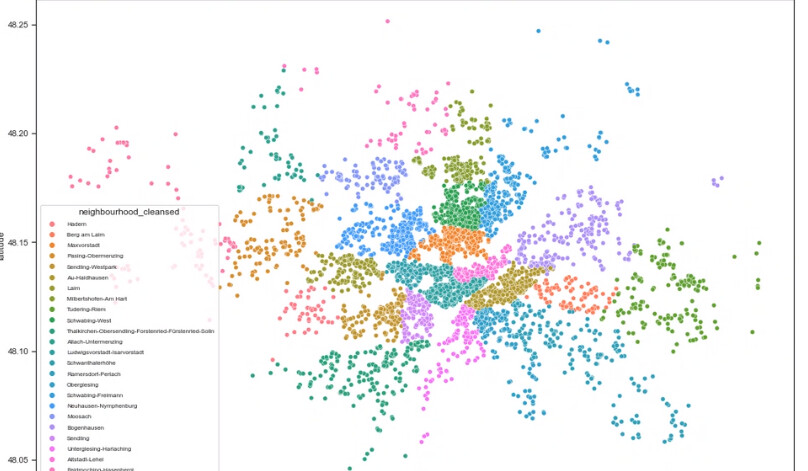
I have plotted values from a dataframe of munich and would like to put a map of munich as a background (a bit transparent if it works) so the dots of the values are on the map. I used seaborn sns for the plotting.
Thank you!