In the official examples, I saw this example using fill_between to plot confidence bands of this regression model. But I can’t understand the real meaning of this confidence bands. I guess this is the 95% confidence region, but I think I’m wrong, because there is no word related to 0.95 or 0.05 or any other number. I’m confused about it and hope anyone could help me. Thanks.
The code of this example is as below:
N = 21
x = np.linspace(0, 10, 11)
y = [3.9, 4.4, 10.8, 10.3, 11.2, 13.1, 14.1,  9.9, 13.9, 15.1, 12.5]

# fit a linear curve an estimate its y-values and their error.
a, b = np.polyfit(x, y, deg=1)
y_est = a * x + b
y_err = x.std() * np.sqrt(1/len(x) +
                          (x - x.mean())**2 / np.sum((x - x.mean())**2))

fig, ax = plt.subplots()
ax.plot(x, y_est, '-')
ax.fill_between(x, y_est - y_err, y_est + y_err, alpha=0.2)
ax.plot(x, y, 'o', color='tab:brown')
appears to be a mistake, as it does not look like any valid statistical error formula to me. The closest error formula I can find is the standard error of the mean of the response variable, which would be the following. The first term should be the standard deviation of the residuals rather than the standard deviation of the x-values.
I think this is the formula that the example was intending to use. If so, the corrected formula would lead to error bands that represent a 68% confidence interval for the mean of y-values given an x-value.
Thanks for your reply. But I just can’t believe that the code or the formula in official documentation is wrong. Here is the web of this example.
You said this could be the 68% confidence interval, I think it’s due to the standard error, right? So what can I do if I want to draw a confidence band representing 95% confidence interval? Should I use another formula?
Errors in documentation do happen; I think the only way to figure out whether the formula has an error is to ask the matplotlib developers.
The 68% figure comes from the fact that that an estimate plus or minus one standard error represents a 68% confidence interval. The 95% confidence interval would be an estimate plus or minus 1.96 standard errors. In that case, you would multiply y_err by 1.96.
Hi, I have some new information about how to calculate the 95% interval. I find that we need to multiply y_err by t(0.025, n-2) instead of always by 1.96. And generally, if we want to calculate the 1-alpha interval, we need to multiply y_err by t(alpha/2, n-2), where n is the length of the x or y. When n is very large (like 10000), the t(alpha/2, n-2) is approximately equal to norm(alpha/2), like t(0.025, n-2) is approximately equal to 1.96 when n is very large. Am I right?
And… I got somewhat confused after I tried to use seaborn to draw the confidence interval. When I just used seaborn.regplot(x, y, ci=95), I found that the interval does not look like using an estimate plus or minus a number, in another word, it plus or minus the different number at the same x point (as shown in the figure below). So is there are some mistakes in the drawing using matplotlib? Or, are they the different methods to draw the figure? Which one should I use to draw the 95% confidence interval? And how to use matplotlib to draw the right one? Thanks!
You’re right that for a small amount of data, you should use t(0.025,n-2), which approaches 1.96 as n gets large.
I’m not sure why seaborn shows confidence bands that are not symmetric about the regression line. All the examples in the seaborn documentation show a symmetric plot unless a logistic or logarithmic regression is made.
Note that when it comes to a regression, there are two 95% confidence interval bands you could draw, and the plot depends on which confidence interval you want.
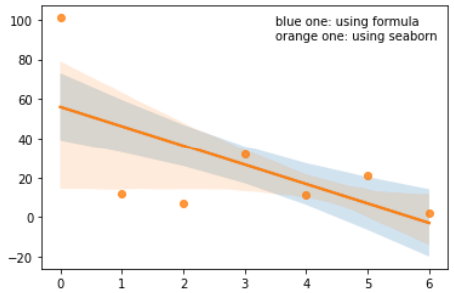
I found that seaborn.regplot tends to draw asymmetrical confidence bands when the y data is ‘steep’, just like the data in this example (shown at the top of this page). But I don’t know why. Furthermore, when I try to regress very steep and waved data, the interval calculated by seaborn.regplot(x, y, ci=68.27) has a huge difference with that calculated by the formula you told me before:
The difference in the confidence intervals can be easily noticed in the figure below, which I use the following code to draw.
import numpy as np
import matplotlib.pyplot as plt
import seaborn as sns

x = np.arange(7)
y = np.array([101,12,7,32,11,21,2])
n = x.size

# calculate interval manually using the formula
a, b = np.polyfit(x, y, deg=1)
y_est = a * x + b
y_err = (y-y_est).std() * np.sqrt(1/n + (x - x.mean())**2 / np.sum((x - x.mean())**2))

fig, ax = plt.subplots()

# plot manually calculated interval (std interval) --- the blue one
ax.plot(x, y_est, '-')
ax.fill_between(x, y_est - y_err, y_est + y_err, alpha=0.2)

# plot seaborn calculated interval (std interval, i.e. when ci=68.27) --- the orange one
sns.regplot(x=x, y=y, ci=68.27)

plt.text(3.5,90,'blue one: using formula\norange one: using seaborn')
plt.show()
Looking forward to your reply about why they are not the same, and which one I should take (using formula or using seaborn). Thank you!
The documentation at seaborn.regplot — seaborn 0.11.2 documentation says that seaborn uses bootstrapping to draw a confidence interval. Bootstrapping is a statistical technique that calculates a confidence interval in a different way than the formula I used. I’m not a statistics expert, so I don’t know when bootstrapping would be preferred over my formula. I suspect that the answer depends on the kind of data you are using.
Thank you so much!
Although I noticed the bootstrapping in the documentation, I didn’t realize that would be the reason. Thanks for your constructive tips!