I’ve been testing out a code from a video where it shows how to use custom widgets with graphs. Here’s an excerpt where I’m creating a percentage graph with the necesarry data being used froma csv file:
import os
import csv
from propiedades import *
from PyQt5 import QtCore, QtGui, QtWidgets, QtChart
from PyQt5.QtChart import *
from PyQt5.QtWidgets import QApplication, QMainWindow
from PyQt5.QtGui import *
from PyQt5.QtCore import *
from functools import partial
from Custom_Widgets import *
from Custom_Widgets.QAppSettings import QAppSettings
shadow_elements = { "left_menu","frame_3", "frame_5", "header", "frame_8"}
class MainWindow(QMainWindow):
def __init__(self,parent=None):
QMainWindow.__init__(self)
self.ui = Ui_MainWindow()
self.ui.setupUi(self)
self.setMinimumSize(850,600)
loadJsonStyle(self, self.ui)
for x in shadow_elements:
effect = QtWidgets.QGraphicsDropShadowEffect(self)
effect.setBlurRadius(18)
effect.setXOffset(0)
effect.setYOffset(0)
effect.setColor(QColor(0,0,0,255))
getattr(self.ui,x).setGraphicsEffect(effect)
self.create_percentage_chart()
self.show()
def create_percentage_chart(self):
yearList = {}
wealth = {}
rowCount = 0
with open('C:\\Users\\UserPC\\OneDrive\\Documentos\\ProjectSICI\\App\\csv\\prueba.csv') as csvfile:
csvreader = csv.reader(csvfile,delimiter=',')
for row in csvreader:
print(row)
if rowCount > 0:
if not row[2] in yearList:
yearList[row[2]] = []
yearList[row[2]].append({"name": row[0],"wealth": row[4]})
else:
yearList[row[2]].append({"name": row[0],"wealth": row[4]})
rowCount += 1
series = QtChart.QPercentBarSeries()
nameList = []
for x in yearList:
for z in yearList[x]:
if not z["name"] in nameList:
nameList.append(z["name"])
if not z["name"] in wealth:
wealth[z["name"]] = []
wealth[z["name"]].append(float(z["wealth"]))
else:
wealth[z["name"]].append(float(z["wealth"]))
for x in nameList:
setattr(self,"set"+str(x), QtChart.QBarSet(str(x)))
series.append(getattr(self,"set"+str(x)))
getattr(self,"set"+str(x).append(wealth[x]))
chart = QtChart.QChart()
chart.addSeries(series)
chart.setTitle("Billionares")
chart.setAnimationOptions(QtChart.QChart.SeriesAnimations)
categories = yearList
axis = QtChart.QBarCategoryAxis()
axis.append(categories)
chart.createDefaultAxes()
chart.setAxisX(axis,series)
chart.legend().setVisible(True)
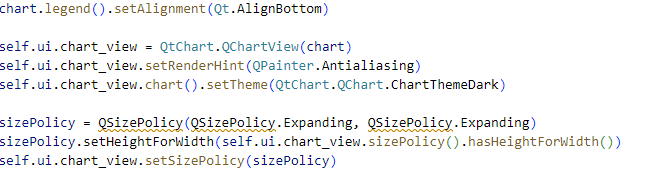
chart.legend().setAlignment(Qt.AlignBottom)
self.ui.chart_view = QtChart.QChartView(chart)
self.ui.chart_view.setRenderHint(QPainter.Antialiasing)
self.ui.chart_view.chart().setTheme(QtChart.QChart.ChartThemeDark)
sizePolicy = QSizePolicy(QSizePolicy.Expanding, QSizePolicy.Expanding)
sizePolicy.setHeightForWidth(self.ui.chart_view.sizePolicy().hasHeightForWidth())
self.ui.chart_view.setSizePolicy(sizePolicy)
self.ui.chart_view.setMinimumSize((QSize(0,300)))
self.ui.gridLayout_3.addWidget(self.ui.chart_view)
self.ui.frame_19.setStyleSheet(u"background-color: transparent")
if __name__ == "__main__":
import sys
app = QApplication(sys.argv)
window = MainWindow()
window.show()
sys.exit(app.exec_())
I’m currently using Python 3.11 and I’m curious as to why methods like QPainter.Antialiasing, QSizePolicy and Qt.AlignBottom aren’t working. As I’m using VS Code, here’s what it’s showing me:
I’ve been writing this code from a video and the uploader used Python 3.7 (or 3.8) and PySide2, but I prefer to use PyQt5 and Python 3.11. Anyway to fix this?